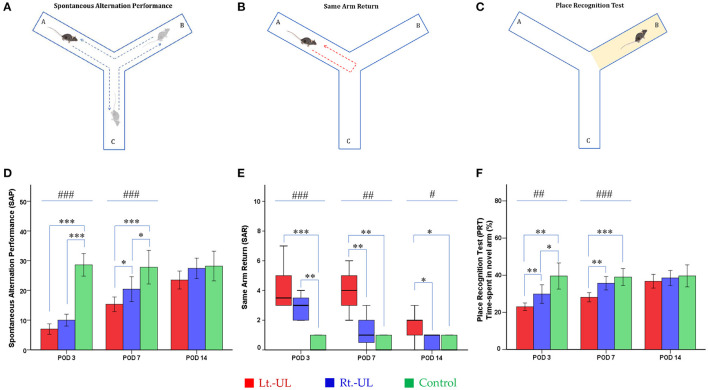
Figure 3.
Evaluation of locomotor activities and spatial navigation in the Y maze test. The spontaneous alternation performance (SAP) (A) of Lt.- and Rt.-UL groups decreased on POD 3 and 7 compared with the control group. The SAP values of the Lt.-UL group were significantly lower than those of the Rt.-UL group on POD 7. (D) The same arm return (SAR) (B) was significantly increased in both Lt.-UL and Rt.-UL groups on POD 3 compared with the control group. While the SAR value of the Rt.-UL group decreased to the level of the control group on POD 7, the SAR of the Lt.-UL group increased on POD 7 and 14 compared with the control group. The Lt.-UL group showed significantly increased SAR compared with the Rt.-UL group on POD 7 and 14 (E). The place recognition test (PRT) (C), an indicator of spatial reference memory, was significantly decreased in both Lt.-UL and Rt.-UL groups compared with the control group on POD 3 (F). While the PRT value of the Rt.-UL group improved to the level of the control group on POD 7, the value of the Lt.-UL group remained lower than that of the control group on POD 7. The Lt.-UL group showed significantly reduced PRT values compared with the Rt.-UL on PODs 3 and 7 (F). The values of SAP and PRT were indicated as mean ± SD, and the p-values were calculated using one-way ANOVA with post-hoc tests. The values of SAR were indicated as median (quartile range), and the p-values were calculated using the Kruskal–Wallis test and the Mann–Whitney U-test. *Significantly different between two groups; #significantly different between three groups; *, #p < 0.05; **, ##p < 0.01; ***, ###p < 0.001.

