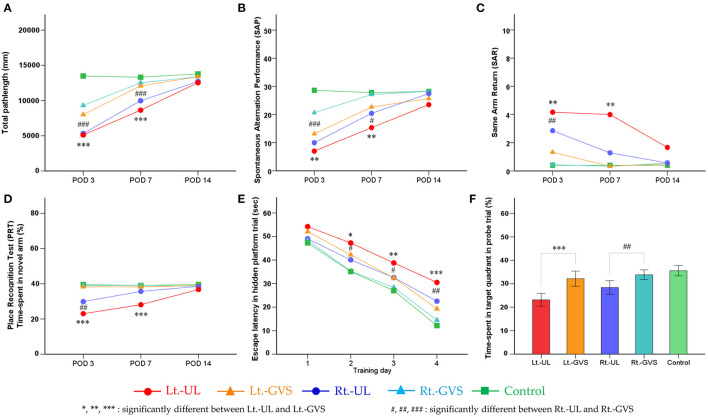
Figure 5.
Effects of galvanic vestibular stimulation (GVS) on the recovery post-UL. Bilateral bipolar GVS was applied as paradigms of cathode left–anode right (CLAR) for Lt.-GVS and cathode right–anode left (CRAL) for Rt.-GVS. Locomotion was reflected by the total path length on PODs 3 and 7 (A) and by SAP on PODs 3 and 7 (B) were markedly improved after GVS applications in both groups. The subgroup analysis between the Lt.- and Rt.-GVS groups revealed that the GVS intervention was significantly effective in the Rt.-UL mice compared with the Lt.-UL mice on POD 3 on total path length (A) and SAP (B). Short-term spatial memory and attention reflected by SAP, SAR, and PRT during the Y maze were significantly improved after bipolar GVS intervention in both groups. The GVS protocol exhibited positive effects on the recovery of SAP on PODs 3 and 7. SAR showed significant improvement after GVS intervention in both side groups on POD 3 and the left side group only on POD 7. The GVS intervention was significantly more effective in the Rt.-UL mice than the Lt.-UL mice on POD 7 (C). PRT was significantly improved after GVS on POD 3 and POD 7. Subgroup analysis revealed that the GVS intervention was more effective in the Rt.-UL mice than the Lt.-UL mice on POD 3 and POD 7 (D). Long-term consolidative spatial memory reflected by the escape latency in MWM was improved after GVS in both side groups on hidden platform training days (TDs) 2, 3, and 4. There was, however, no noticeable difference between the Lt.-GVS and Rt.-GVS groups (E). The probe trial on POD 14 showed substantial improvement after GVS intervention in both side groups with a significant difference between the Lt.-GVS and Rt.-GVS groups (F). Values are indicated as mean. Statistical significances were calculated using the one-way ANOVA with post-hoc tests, except the Kruskal–Wallis test combined with Mann–Whitney U-test for SAR. The difference in the influence of GVS on CLAR and CRAL models was analyzed by independent t-test values comparing the delta values of Lt.-GVS and Lt.-UL to the respective delta values of Rt.-GVS and Rt.-UL. *Significant difference between Lt.-UL and Lt.-GVS; #significant difference between Rt.-UL and Rt.-GVS; *, #p < 0.05; **, ##p < 0.01; ***, ###p < 0.001.

