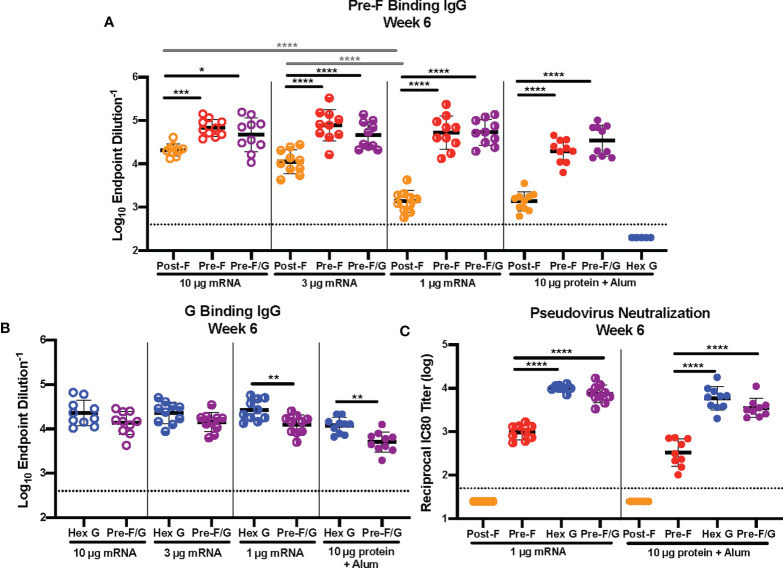
Figure 1.
mRNA Dose-Response Study. (A, B) Serum samples were assessed for NiV pre-F specific IgG (A) or monomeric G-specific IgG (B) by enzyme-linked immunosorbent assay (ELISA). Line represents mean of all animals in each group +/- standard deviation. (C) VSVΔG-luciferase pseudovirus neutralization assays were performed on individual mouse sera collected at week 6. The log10 reciprocal IC80 neutralization titers for each sample was calculated by curve fitting and non-linear regression using GraphPad Prism. Line represents mean of log10 reciprocal IC80 dilution +/- standard deviation. P values were calculated using two-way ANOVA with Tukey’s multiple comparisons test (*p < 0.05, **p < 0.01, ***p < 0.001, ****p < 0.0001). Dotted lines represent assay limits of detection.

