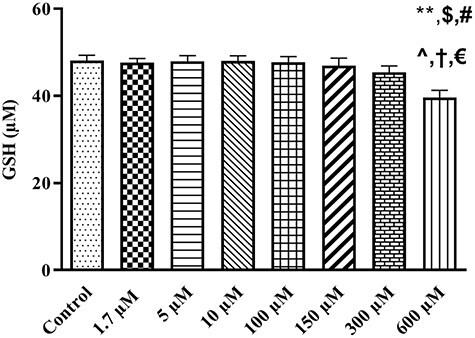
Figure 4.

The influence of different concentrations of TR (1.7–600 µM) on GSH content in rat liver isolated mitochondria. Values represented as mean ± SEM (n = 5). *(p < 0.05): Significantly different compared with control mitochondria. $(p < 0.05): Significantly different compared with 1.7 µM group. #(p < 0.05): Significantly different compared with 5 µM group. ^(p < 0.05): Significantly different compared with 10 µM group. †(p < 0.05): Significantly different compared with 100 µM group. €(p < 0.05): Significantly different compared with 150 µM group.
