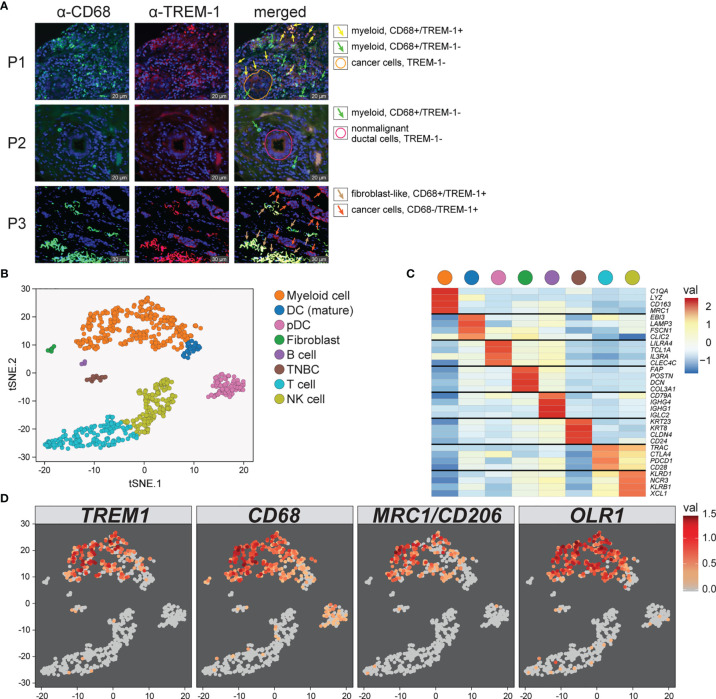
Figure 6.
Characterization of TREM1 expression in the breast tumor microenvironment by IF and single-cell RNAseq. (A) Representative patterns (P) of TREM-1 (red) and CD68 (green) immunofluorescent staining in breast tumor sections. DRAQ5-stained nuclei are shown in blue pseudocolor. (B) Single-cell RNA sequencing was performed on freshly dissociated cells of a stage III primary triple negative breast tumor. Expression profiles of 770 cells were K-means clustered and resolved spatially in a tSNE plot. (C) Cell identities in (B) were assigned based on significant expression of canonical marker genes. Mean-centered averages of cluster-specific gene expression are shown in the heatmap. (D) Relative expression levels of TREM1, CD68, MRC1 (M2 macrophage marker) and OLR1 (MDSC marker) are shown.

