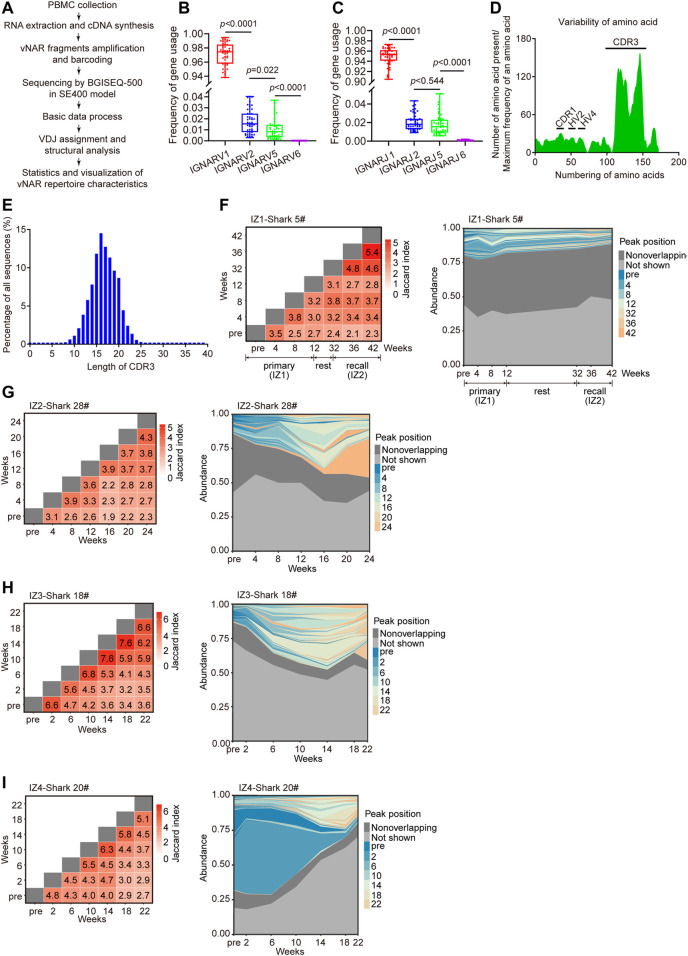
FIGURE 3.
Development of vNAR immune repertoire of bamboo sharks during immunization. (A) Schematic for the characterization of vNAR immune repertoire constructed from immunized sharks. (B, C) Usage frequency of V/J genes from four IgNAR clusters. Statistical significance is indicated by the p value. (D, E) Variability of amino acid sequences (D) and CDR3 lengths (E) of vNARs (n = 3,00,000). CDR, complementarity determining region; HV, hypervariable region. (F, I) Clonotype overlap and clonotype tracking of vNAR immune repertoire of bamboo sharks during immunization. Peak positions represent the abundance profiles of top 100 clonotypes (colored), non-overlapping clonotypes (dark gray), and remaining (Not shown) clonotypes (light gray). Value in each tile of heatmap represents the clonotype overlap rate between two time points as shown on the two axes.

