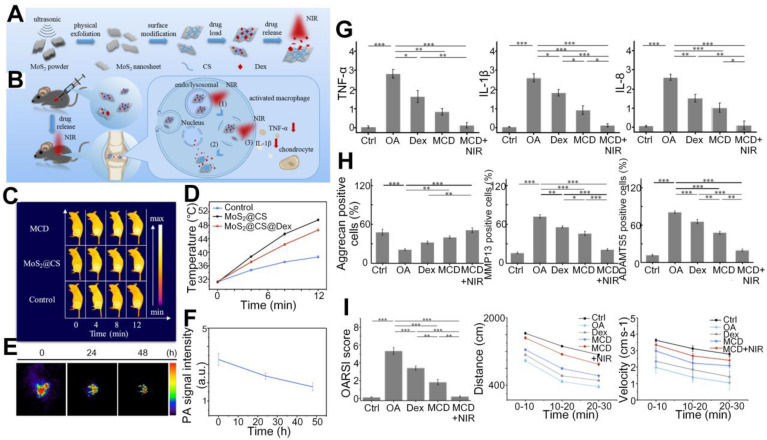
Figure 10.
(A) - (B) Schematic diagram of the synthetization and reaction process of the MCD nanoparticles. (C)- (F) Photothermal effect and remaining time duration of the MCD in mouse joints. (G) - (I) Semiquantitative comparisons of inflammatory factors (TNF-α, IL-1β, and IL-8), therapy outcomes (three proteins associated with OA pathology and cartilage reconstruction), composite scores, movement distance, and velocity in OA joints among different treatment methods. Figures adapted with permission from Ref. 95. Copyright © 2019, American Chemical Society.

