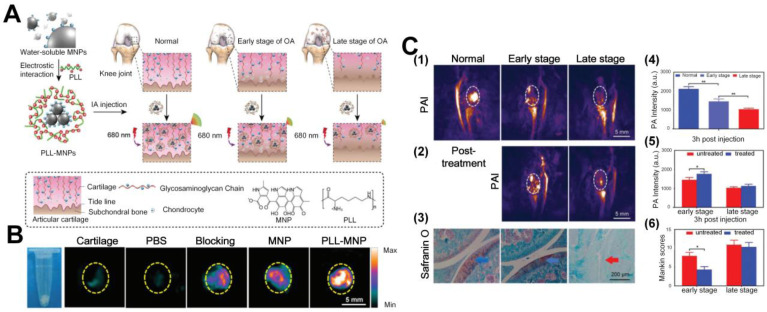
Figure 8.
(A) Schematic diagram of the preparation of PLL-MNPs and the mechanism of diagnosis of OA cartilage degeneration with PAI. (B) PA images of cartilage after immersion in different contrast media for 24 hours. Scale bar: 5 mm. (C) PA images of early and late stages of OA with PLL-MNPs, PA post-treatment monitoring after hyaluronic acid (HA) injection, and its comparison with Mankin scoring system results. Figures adapted with permission from Ref. 92. Copyright © 2018, Royal Society of Chemistry.

