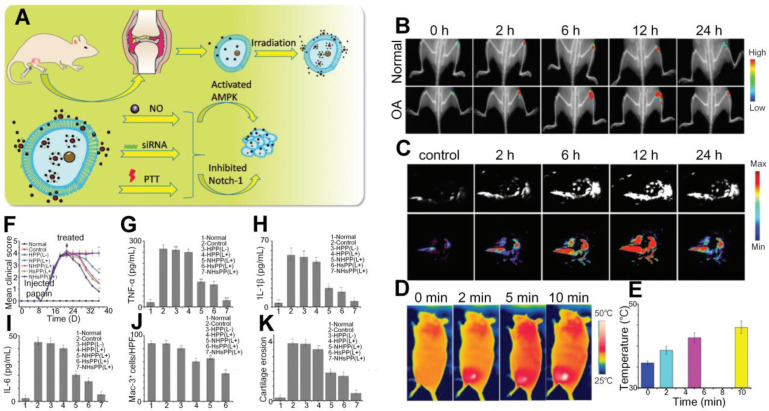
Figure 9.
(A) Reaction process of the NHsPP nanoparticles in the OA after light illumination. (B) Spatial distributions of NHsPP nanoparticles in the OA and normal joints at different times. (C) PA signals of the nanoparticles in the OA joints at different time. (D) Nanoparticle-enhanced photothermal images under laser irradiation. (E) The temperatures changes with time under the photothermal effect. (F-K) Semi-quantitative comparisons between different treatment methods as a function of time. Figures adapted with permission from Ref. 29. Copyright © 2019, Royal Society of Chemistry.

