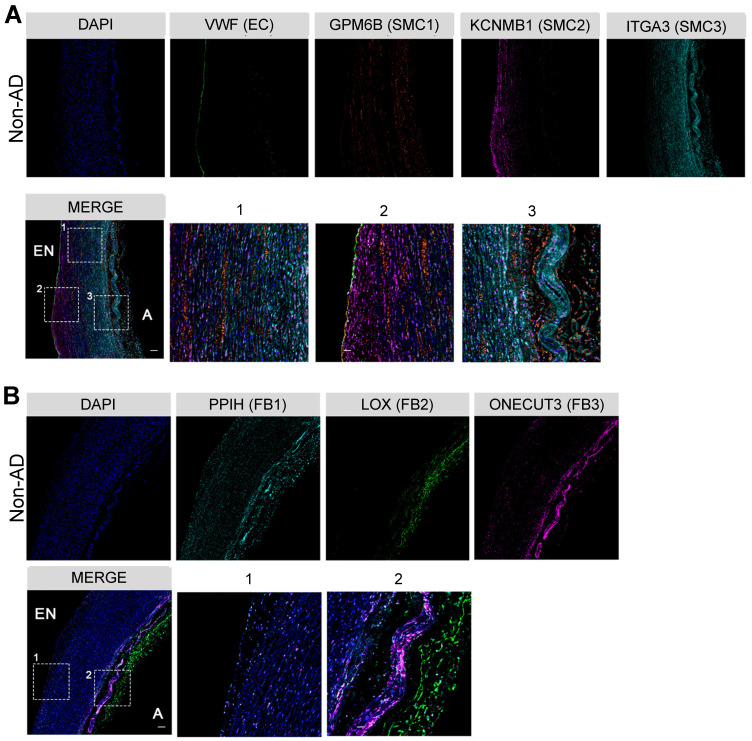
Figure 2.
Characterization of cellular spatial distribution of human thoracic aorta. (A) Co-staining of EC marker VWF and SMC cluster-specific markers (SMC1, GPM6B; SMC2, KCNMB1; SMC3, ITGA3) in Non-AD sections, zone 1, 2 and 3 in merge are magnified on the right. (B) Co-staining of FB cluster-specific markers (FB1, PPIH; FB2, LOX; FB3, ONECUT3) in Non-AD sections, zone 1 and 2 in merge are magnified on the right. Scale bars, 400 μm (top and merge images), 100 μm (magnifications). The images in (A) and (B) represent 3 independent experiments (3 samples each), respectively. EN, endothelium; A, adventitia.

