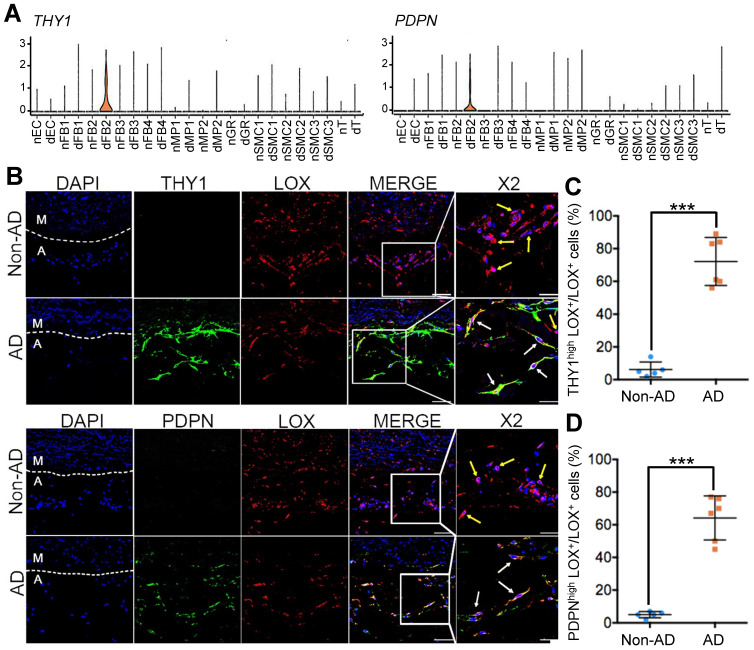
Figure 5.
Expression of dFB2 in human Non-AD and AD samples. (A) Expression levels of specific markers THY1 and PDPN in diseased FB2 (dFB2), as well as in other clusters based on scRNA-seq data. (B) Immunofluorescent staining of FB2 specific marker (LOX) and dFB2 specific markers THY1 or PDPN in human Non-AD or AD sections, respectively. White arrows indicate co-localization, yellow arrows indicate LOX+ only cells. Scale bars, 50 μm (left four columns); 25 μm (magnifications). M, media; A, adventitia. The representative images are from 3 and 4 independent experiments (3 samples each), respectively. (C, D) Quantitative analysis of THY1highLOX+ (C) or PDPNhighLOX+ (D) cells in Non-AD versus AD arteries. n = 3 and 5 in Non-AD and AD group, respectively. ***p < 0.001 (Wilcoxon rank-sum test).

