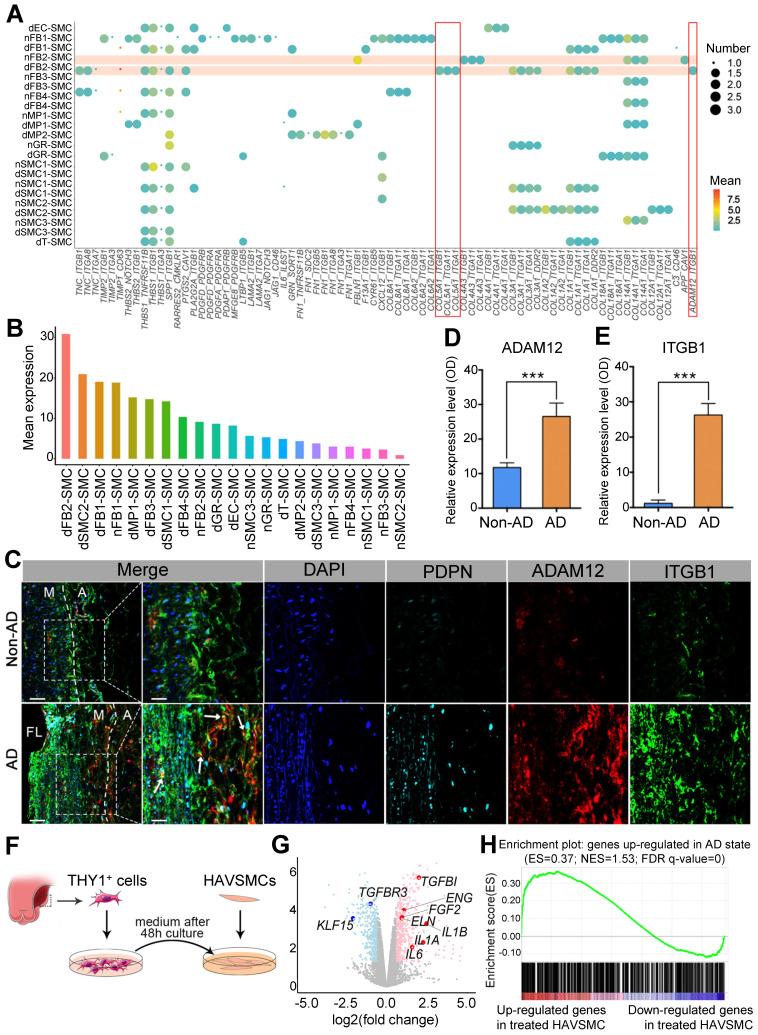
Figure 7.
FB2 affects SMC behaviors via ligand-receptor interaction. (A) Bubble chart to show putative ligand-receptor pairs between differentially expressed ligands in Non-AD state (n-) or AD state (d-) of each cell cluster and corresponding receptors expressed in SMCs. (B) Quantification of ligand-receptor pairs (A) in each cell type. (C) Co-staining of dFB2-specific marker PDPN, dFB2-specific ligand ADAM12 and corresponding SMC receptor ITGB1 in human aorta sections. White arrows indicate interaction between ligand and receptor. Scale bars, 100 μm (leftmost column); 50 μm (magnifications). M, media; FL, false lumen; A, adventitia. Representative images are from 3 independent experiments (3 samples each time point). (D, E) Quantification of ADAM12 (D) and ITGB1 (E) in (C). n = 3. ***p < 0.001 (Wilcoxon rank-sum test). (F) Schematic to show culture of human aortic SMCs (HAVSMCs) with conditioned medium from dFB2. (G) Volcano plot to show DEGs in HAVSMCs cultured with conditioned medium. Red and blue colors respectively represent up- and down-regulated genes in treated HAVSMCs cultured in dFB2-conditioned medium. (H) Gene Set Enrichment Analysis (GSEA) showing that genes up-regulated in HAVSMCs cultured in conditioned medium were enriched for genes that were highly expressed in AD state.

