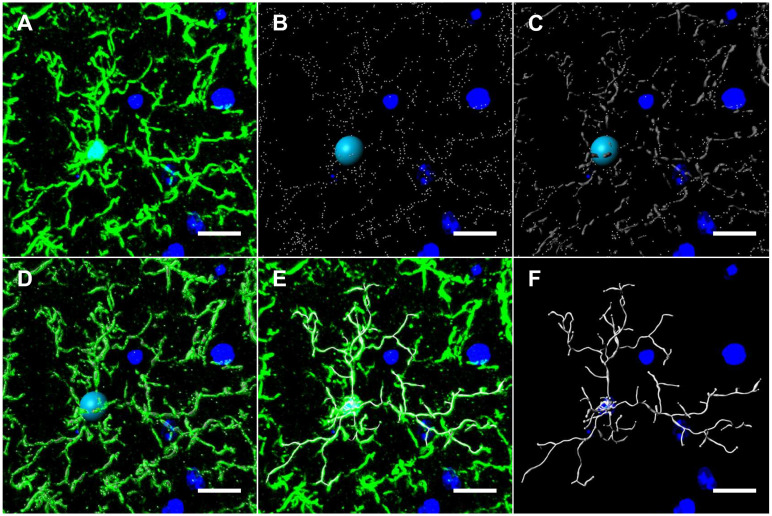
Figure 5.
Microglia modeling workflow using Imaris. (A) 20 µm-thick mouse hippocampal sections stained with Iba1 were imaged at 1 μm slice intervals at 40x magnification and combined to form a focused, Z-stack image. The isolated Iba1+ GFP channel was 3D modeled using Imaris' filament tracer function. (B) Briefly, filament starting points and seed point thresholds were defined by soma diameter size and distal filament diameter, respectively. (C) The signal threshold for the detection of filaments was adjusted based on filament diameter size. (D) Iba1+ GFP channel overlaid with threshold detection and seed point representations as seen in B and C. (E) Iba1+ GFP channel overlaid with 3D filament render. (F) Final 3D rendering of Iba1+ microglia, allowing for automated quantification of filament length, branching level and Sholl analysis. Scale bars = 10 µm.

