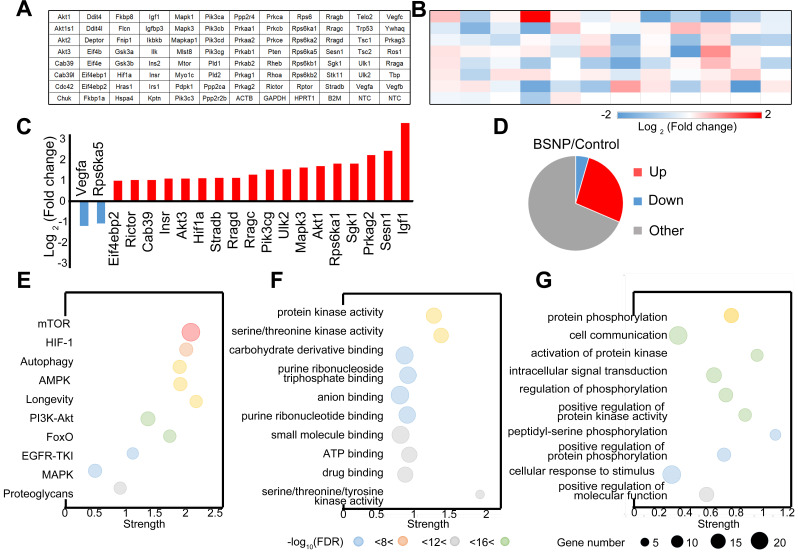
Figure 8.
Expression pattern of mTOR pathway related genes in trained immunity macrophages from BSNP-treated mice. (A) Plate layout of PCR array. (B) Heat map showed fold changes of genes in macrophages from BSNPs treated mice versus control mice. (C) Major differentially regulated mTOR pathway genes. (D) Pie chart displayed number of differentially regulated genes. (E-G) Enriched GO categories of major differentially regulated genes in (E) neighborhood signaling pathway, (F) biological process and (G) functions.

