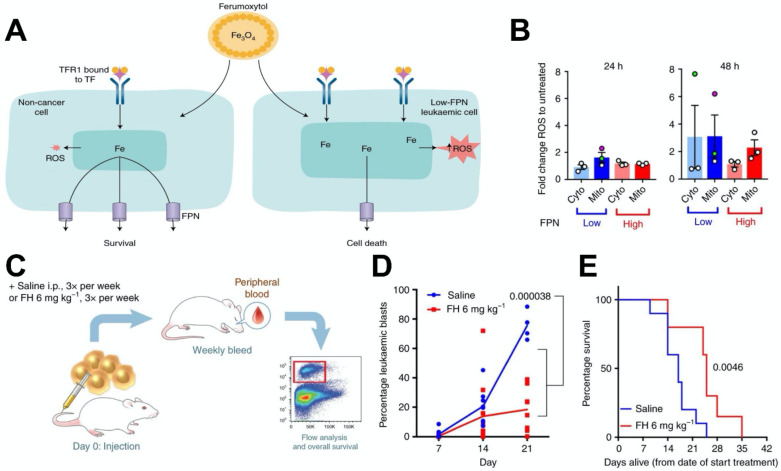
Figure 6.
(A) A schematic depiction of how ferumoxytol induces selective cell death for leukaemic cells with low FPN expression. (B) ROS staining in cytoplasm and mitochondria indicate enhanced ROS levels in cell lines with low FPN expression. (C) Schematic depiction of the design of the experiment to investigate the effect of ferumoxytol on the survival rate in a mouse model of leukaemia. (D) Effect of ferumoxytol treatment on leukaemic blast levels. (E) The survival plot for mice administrated using saline or ferumoxytol. Reproduced with permission from reference 149, 150.

