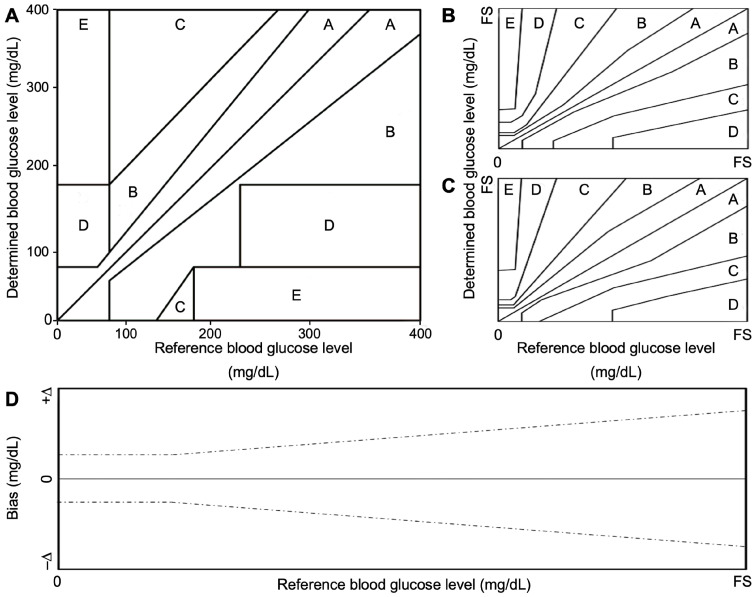
Figure 2.
Error grid analysis proposed by Clarke et al., for clinical accuracy (A), and further modified by Parkes et al., for type 1 (B) and type 2 (C) diabetes. System bias plot (D), dashed black lines indicate the predetermined accuracy limits. FS represents the full-scale level for glucose concentration of the tested and reference sensor. Classically, it is set at 400 mg/dL (blood-based sensors).

