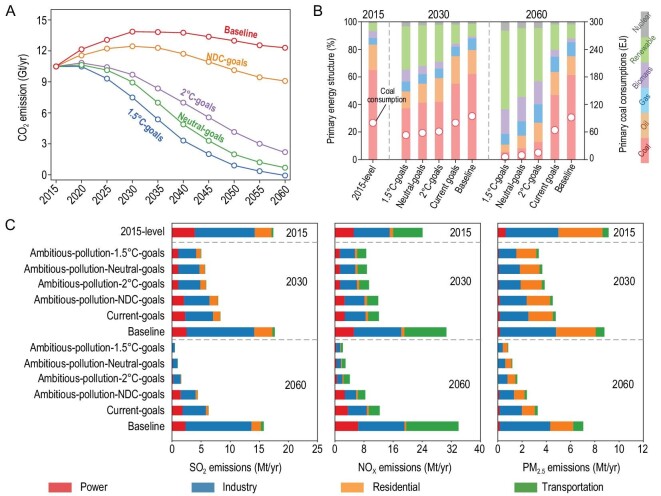
Figure 1.
Future anthropogenic emission pathways and energy transitions over China. (A) Anthropogenic CO2 emissions between 2015 and 2060. (B) Primary energy structure (stacking histogram with the left Y-axis) and coal consumption (red circles with the right Y-axis) in 2015, 2030 and 2060. (C) Future air pollutant emissions (SO2, NOx and primary PM2.5) by sector in 2015, 2030 and 2060 under different mitigation pathways.

