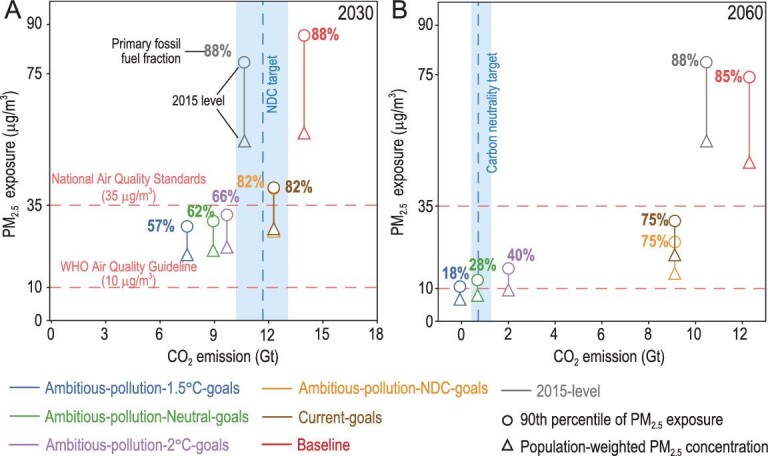
Figure 2.

Accessibility of future climate targets and air quality improvements over China. Estimates of future CO2 emissions and PM2.5 exposure under different mitigation pathways in (A) 2030 and (B) 2060. The circle and triangle markers represent the 90th percentile of PM2.5 exposure and the population-weighted PM2.5 concentration, respectively. Labeled percentage numbers refer to the fossil fuel fraction in the primary energy mix. The horizontal red dashed lines represent the National Ambient Air Quality Standards (i.e. 35 μg/m3) and WHO Air Quality Guideline (i.e. 10 μg/m3). Light blue shaded portions are the ranges of published and simulated results on China's anthropogenic CO2 emission peak under the NDC target (in panel A) and the projected natural carbon sink in 2060 under low radiation forcing scenarios (in panel B). The dark blue dashed line represents the mean value of collected data.
