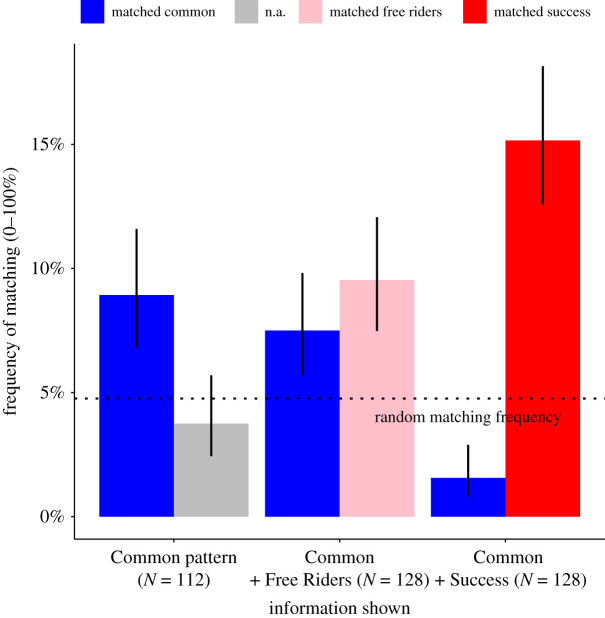
Figure 3.
Copying success and not the Common pattern. We estimated how often individuals copied the social information by recording how often their contributions matched the previous social information (blue = matched Common pattern; grey = matched Success pattern by chance (n.a.), pink = matched Free Rider pattern, red = matched Success pattern, along with 95% binomial confidence intervals). We also show an expected frequency of chance matching, calculated as 1/21 (because contributions could range from 0 to 20 MU). The Common pattern was shown in all three treatments, but the Success pattern was not shown in the Shown Common pattern treatment (grey) and was framed as the ‘lowest contributors’ rather than the ‘highest earners’ in the Shown Common + Free Riders treatment (pink). Individuals preferred to match success over the Common pattern. (Online version is in colour.)

