Figure 3.

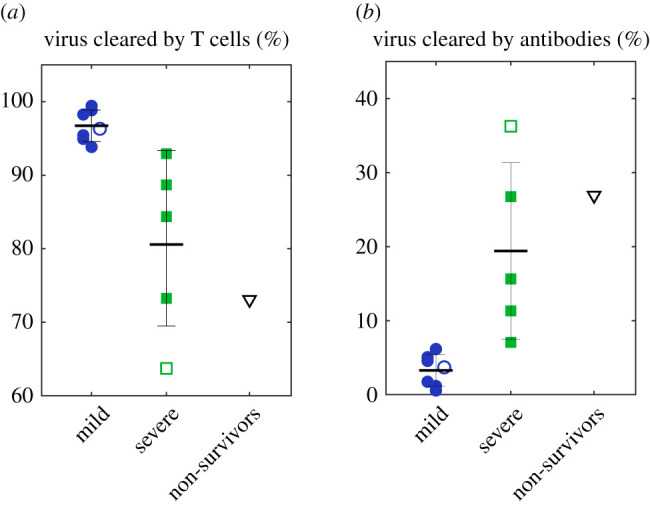
An overall statistic of the fraction of virus killed by T cells (a) and antibodies (b) for all cases. Solid markers are individual data, and hollow markers are group data. Error bars represent standard errors.

An overall statistic of the fraction of virus killed by T cells (a) and antibodies (b) for all cases. Solid markers are individual data, and hollow markers are group data. Error bars represent standard errors.