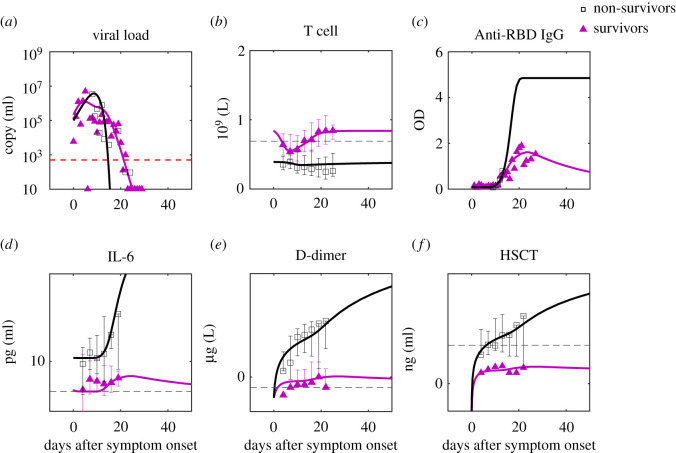
Figure 4.
Comparison of predictions to clinical data of survivors and non-survivors. The data are the median of the group with error bars [3]. For parameter estimation, see Methods and electronic supplementary material. For IgG simulation, we use the ratio of the saturation values of critical and non-critical patients [48] to approximate the ratio of the saturation values of non-survivors and survivors. The red dashed line is the limit of detection and the black dashed lines are the normal ranges of the corresponding markers (see the reference from the electronic supplementary material).

