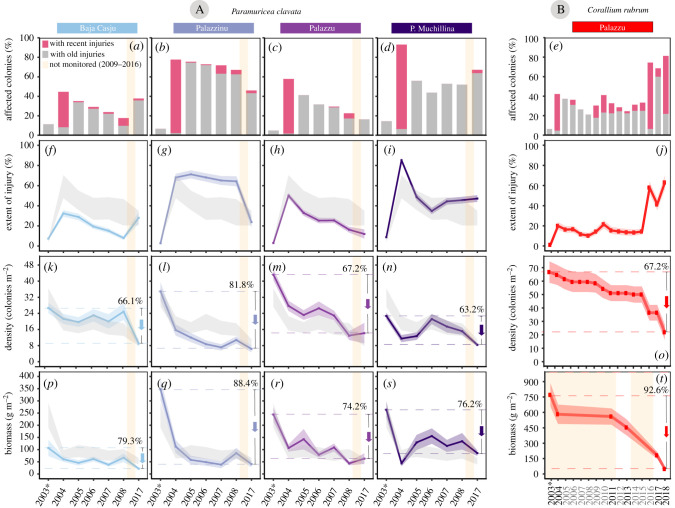
Figure 2.
Temporal trends in the percentage (%) of affected colonies (a–e), percentage of extent of injury ± s.e. (f–j), density (number of colonies per m2 ± s.e.) (k–o) and biomass (g per m2 ± s.e.) (p–t) for the monitored octocoral populations. The cumulated relative density (or biomass) loss is shown at the right side of each plot. The light grey background polygons shown in (f–i, k–n, p–s) represent the average values ± s.e. of the four populations of P. clavata. (Online version in colour.)

