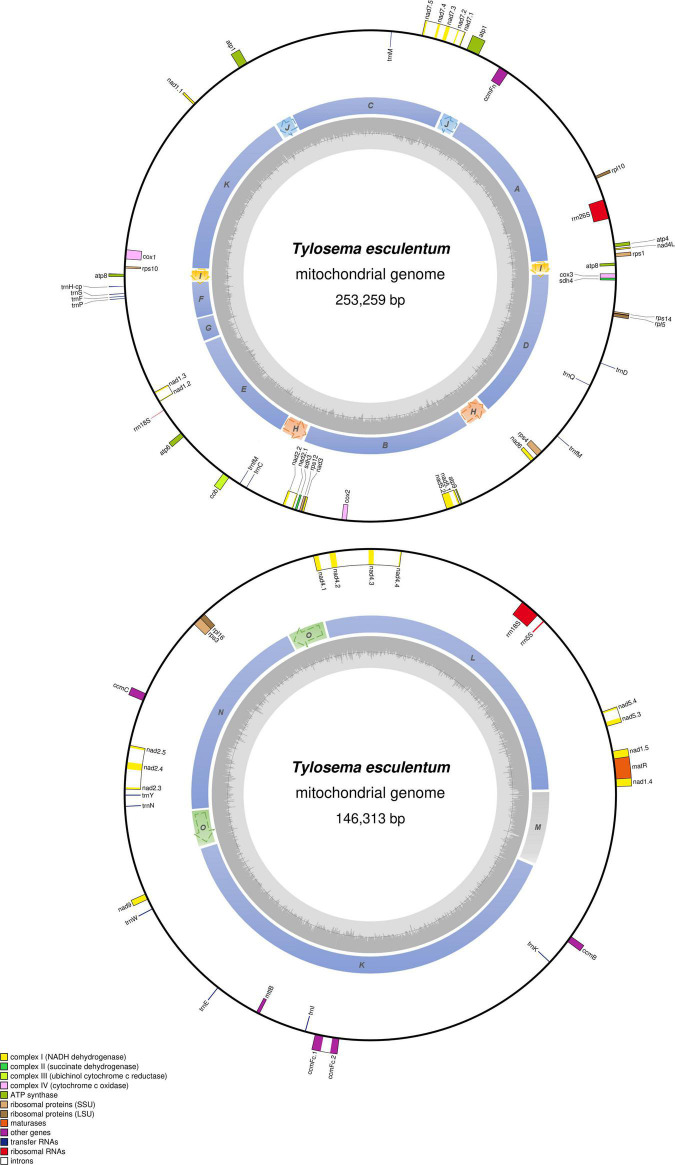
FIGURE 4.
Circular gene map of the two large molecules, LS1 (top) and LS2 (bottom) in the mitochondrial genome of T. esculentum. Genes outside the circle are transcribed clockwise, while genes inside are transcribed counterclockwise. The sequential order of exons is displayed by the decimal after the gene name abbreviation. Genes belonging to different functional groups are color-coded as shown at bottom left. Colors in the inner circle indicate the position of the structural units and repeats listed in Figure 3. The dashed arrows represent the direction of the repeats. GC content is represented by the gray shade in the inner circle.

