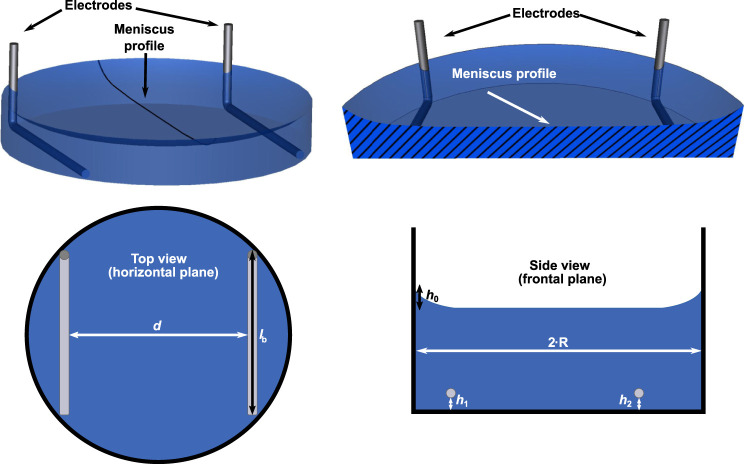
FIGURE 1.
A 3D model of one well with two electrodes is shown (upper row). The radial profile of the meniscus was constructed using Eq. 1. The meniscus profile is highlighted in a cross-section through the centre of the well. Possible parameter choices for the uncertainty quantification (UQ) studies are indicated in sketches of the top and side view of the chamber (lower row): spacing between electrodes d, length of bottom part of electrode l b, height of electrode with respect to bottom of well (h 1, h 2) and height of the meniscus h 0. They account for horizontal or vertical movement of the electrode or variation of the meniscus height in Eq. 1. For more details on the choice of the modelling parameters see also Table 1.

