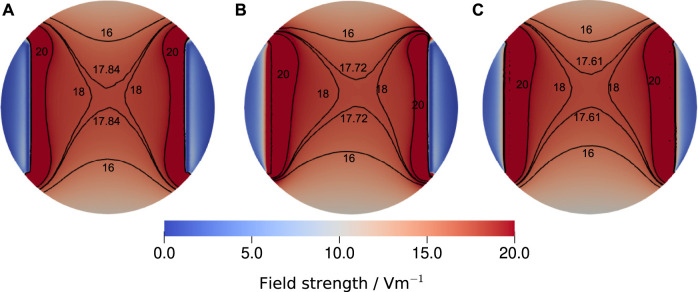
FIGURE 10.
Comparison of the electric field strength at the bottom of the well for the largest experimentally determined EEI impedance at 130 Hz, which was 195.33 Ω, a medium conductivity of 1.38 S m−1, a volume of 3.5 ml and a stimulation voltage of 1 V. Three different configurations were considered: (A) the voltage-divider approach, where the voltage drop across the medium has been computed for the given impedance, (B) the asymmetric distributed configuration, where the Robin boundary condition (Eq. S9) was applied only on the left electrode using the full impedance and (C) the symmetric distributed configuration, where the EEI impedance was divided by two and applied on both electrodes. The reference voltage Φref was equal to the voltages chosen for the Dirichlet boundary conditions. For the sake of comparability, the isolines for 16 V m−1, 18 V m−1 and 20 V m−1 are shown together with the isoline for the field strength at the centre of the well that we reported throughout this manuscript. Evidently, the three modelling approaches yield only slightly different results. Thus, we concluded that the lumped approach, which permits to estimate the field strength without repeat simulations, delivers a sufficiently good estimate of the field strength. More information on the simulation approach are given in the Supplementary Material.

