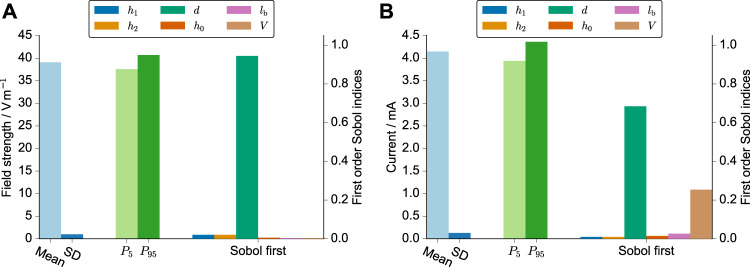
FIGURE 3.
UQ results for the electric field strength (A) and the current (B). The mean, standard deviation, 5th and 95th percentile are shown together with the first-order Sobol indices, which indicate the individual influence of the respective parameter on the simulation result. The varied parameters were the height of the meniscus profile h 0, the height of the left and right electrodes h 1/h 2, the spacing of the electrodes d, the length of the horizontal part of the electrode l b , and the volume of the cell culture medium V. These parameters and their probability distributions are explained in greater detail in Table 1. The simulations were run for an imposed voltage difference of 1 V and a conductivity of 1 S m−1.

