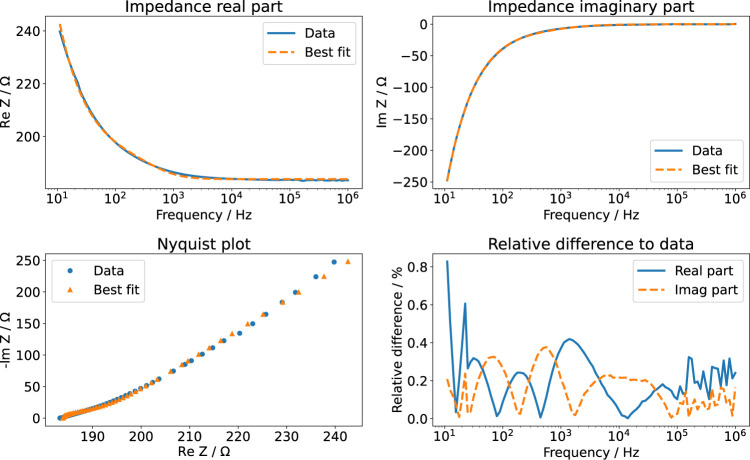
FIGURE 5.
EIS measurement of aqueous KCl solution (3.5 ml). The real part and imaginary part of the measured data are compared to the best fit results using the impedance model of Ragoisha et al. (2010). The relative difference is given with respect to the absolute value of the impedance.

