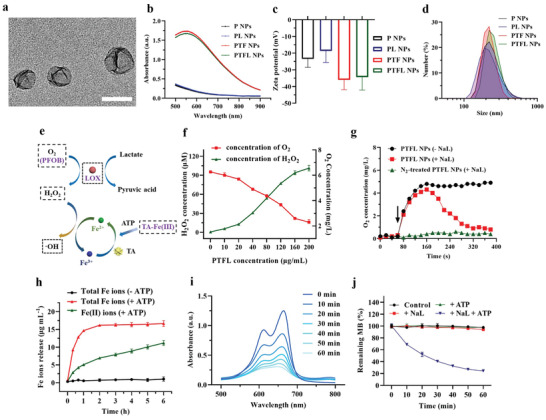
Figure 1.

a) TEM image of PTFL NPs. Scale bar: 200 nm. b–d) Vis‐NIR extinction, Zeta potential, and DLS of P NPs, PL NPs, PTF NPs, and PTFL NPs. Data in (c) are shown as n = 3, mean ± SD. e) Schematic illustration of PTFL NPs induced H2O2 and •OH generation. f) Concentration of H2O2 and dissolved O2 generating from 15 min reaction between various concentrations of PTFL NPs and 10 mm NaL at room temperature (n = 3, mean ± SD). g) O2 concentration after adding PTFL NPs to N2‐treated solution (with/without 10 mm NaL). h). The time‐dependent concentration of total Fe ions release and the converted Fe2+ ions from PTFL NPs by 1 mg mL−1 ATP or without ATP addition, respectively. (n = 3, mean ± SD). i) Time‐dependent methylene blue (MB) (10 mm) degradation by addition of PTFL NPs (200 µg mL−1), ATP (1 mg mL−1), and NaL (10 mm). j) The ratio of remaining MB after treated with 1) 1 mg mL−1 ATP, 2) 10 mm NaL, 3) 1 mg mL−1 ATP + 10 mm NaL. MB without any treatment was set as control (n = 3, mean ± SD).
