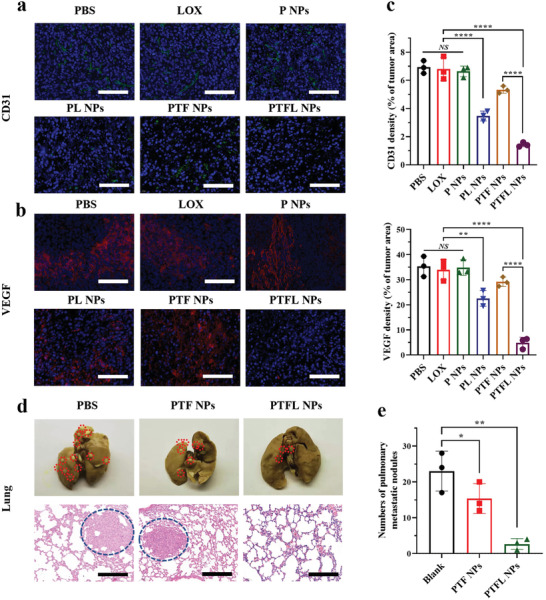
Figure 6.

a) CD31 and b) VEGF immunostaining images and c) the corresponding quantification of CD31 and VEGF densities (n = 3, mean ± SD). Scale bars: 100 µm. d) Representative images of tumor nodules in the lungs with various treatments and e) the corresponding number of lung metastasis nodules (n = 3, mean ± SD). Scale bars: 200 µm. Statistical significance was analyzed by one‐way ANOVA, *P < 0.05,**P < 0.01 and ****P < 0.0001, NS: nonsignificant difference.
