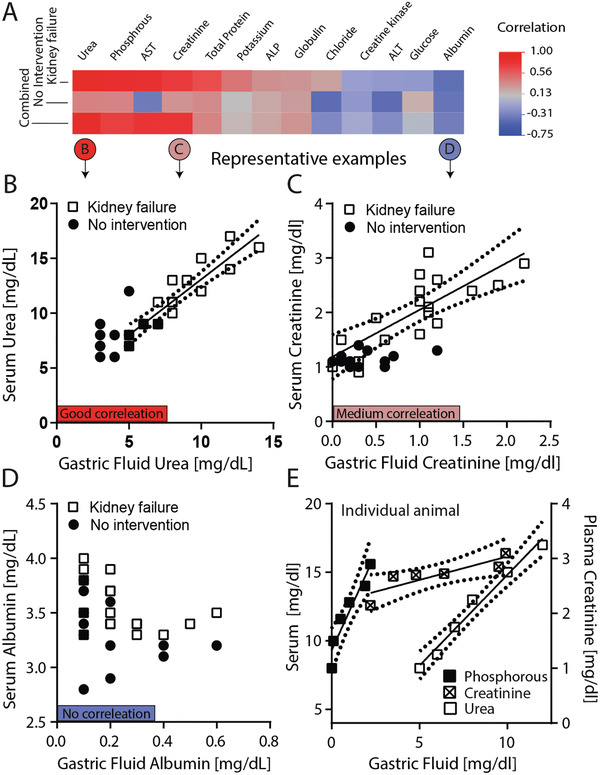
Figure 3.

Correlation of biomarker levels in GF and serum withdrawn from nondiseased pigs (no intervention) and pigs that underwent arterial ligation (kidney failure). A) Heatmap showing the Pearson correlation for i) the kidney failure group (n = 3, sampled for 5 h) and animals without intervention (n = 15). Examples are shown for B) good correlation (urea, r > 0.9), C) medium correlation (creatinine, r > 0.7) and D) no correlation (albumin, r < 0.5). Correlations within A representative animal are shown in E) for phosphorus (left axis), urea (left axis), and creatinine (right axis). The dashed lines indicate the 95% confidence interval.
