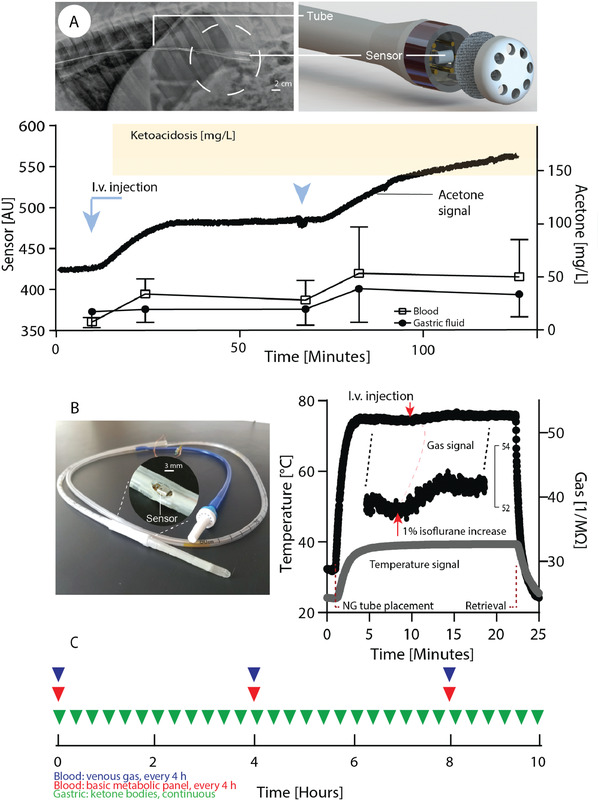
Figure 5.

Figure Capacity of nasogastric (NG) tube compatible sensors to continuously monitor parameters for systemic health in swine. A) Chemically simulated ketoacidosis model. Acetone levels following intravenous injection in swine (indicated by the blue arrows) are monitored by an intragastric semiconductor sensor. The radiographic image shows the sensor after gastric placement. The sensor readout (left axis) over time is shown in comparison to acetone levels in blood and GF (right axis)—for comparison acetone levels commonly found in early ketoacidosis are shown (orange), accordingly.[ 28 ] B) Commercially available NG tube comprising an integrated sensor with the capacity to simultaneously monitor multiple parameters (gas, temperature, pressure, humidity). Sensor readout following gastric placement in swine. The red arrow indicates increase of isoflurane flow from 2% to 3% for 5 min (used to maintain anesthesia). Results are depicted as mean of n = 4 for blood acetone ± SD, one reading is shown for the sensor readouts (see supplementary information for independent repeats as well as humidity / pressure data). C) Comparison of laboratory monitoring with phlebotomy versus gastric sensor over a typical course of diabetic ketoacidosis. Phlebotomy is typically done only every 4 h and provides information only about discrete time points, whereas gastric sensing could provide continuous information.[ 25 ]
