Figure 3.

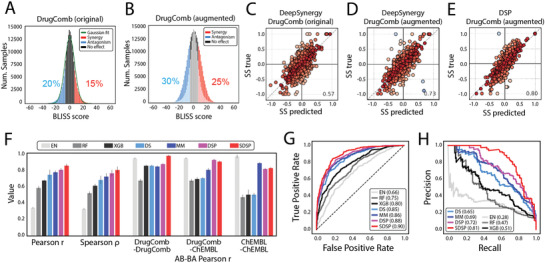
Data augmentation and performance estimation for SMILES‐based drug synergy predictor. A) Data distribution of Bliss synergy scores in original DrugComb samples and B) augmented samples. C–E) Effects of data augmentation and structure modification on the synergy score prediction. Pearson correlation coefficient between true values and predictions. Colors show the difference. Warmer colors indicate minor differences, whereas colder colors indicate significant differences. C) Original DrugComb samples with DeepSynergy (fully connected network). D) Augmented DrugComb samples with DeepSynergy. E) Augmented DrugComb samples with DSP. F) Synergy score predictor performance in the test set. Pearson correlation, Spearman correlation, and AB‐BA Pearson correlation between predictions and labels were compared across different methods. DrugComb‐DrugComb: both drugs were sampled from the DrugComb dataset. DrugComb‐ChEMBL: one drug was sampled from the DrugComb dataset and the other was sampled from the ChEMBL database. ChEMBL‐ChEMBL: both drugs were sampled from the ChEMBL database. G,H) receiver operating characteristic (ROC) and precision‐recall curve (PRC) curves for synergy classification across different methods in the test set. The area under the receiver operating characteristic (AUROC) and the area under the precision‐recall curve (AUPRC) are listed in the boxes. EN: elastic net; RF: random forest; XGB: XGBoost; DS: DeepSynergy; MM: MatchMaker; DSP: drug synergy predictor; SDSP: SMILES‐based drug synergy predictor.
