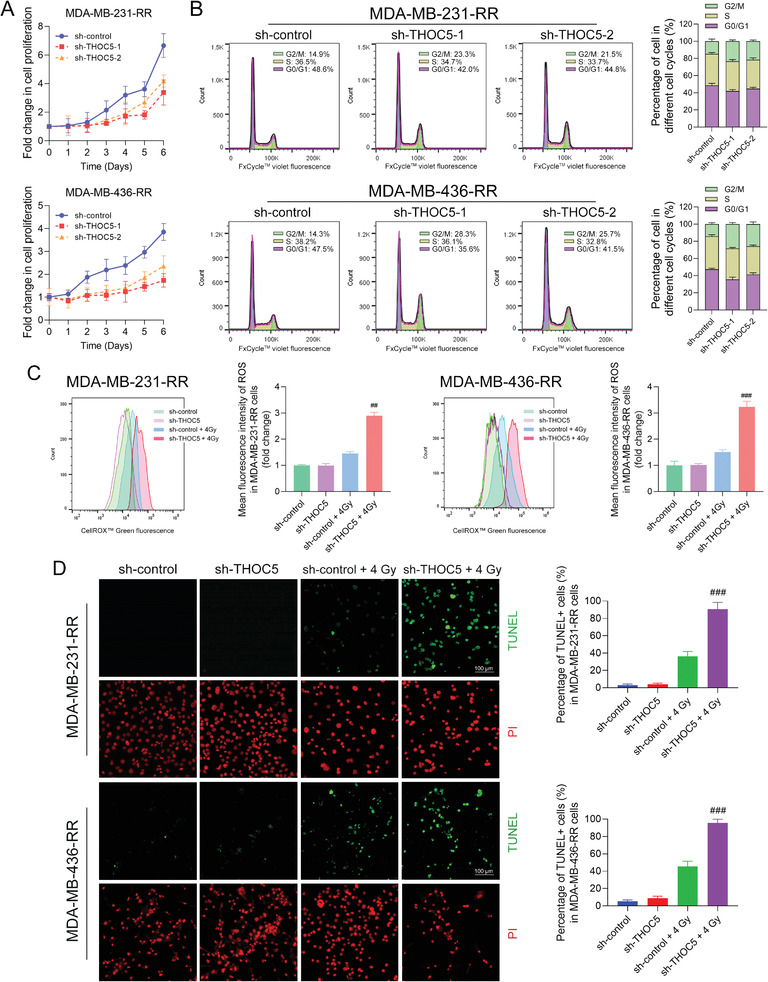
Figure 7.

THOC5 knockdown restores the radiosensitivity of TNBC cells. THOC5 was silenced in MDA‐MB‐231‐RR and 436‐RR cells using a lentiviral system with two different shRNAs. A) The proliferation rate of cells was determined using the proliferation assay. B) The cell cycle was analyzed using flow cytometry. THOC5‐depleted MDA‐MB‐231‐RR and 436‐RR cells were treated with 0 or 4 Gy IR. C) The intracellular level of ROS was detected 24 h after IR using the flow cytometry. The mean fluorescence intensity of ROS was measured and compared. D) The cell apoptosis was evaluated 24 h after IR using the TUNEL assay. Representative images for the TUNEL assay were obtained at 100× magnification. Green fluorescence represents DNA double‐strand breaks, while red fluorescence represents the nuclei. The percentage of TUNEL+ cells was calculated and compared. ## P < 0.01 and ### P < 0.001 versus sh‐control + IR group (n = 3).
