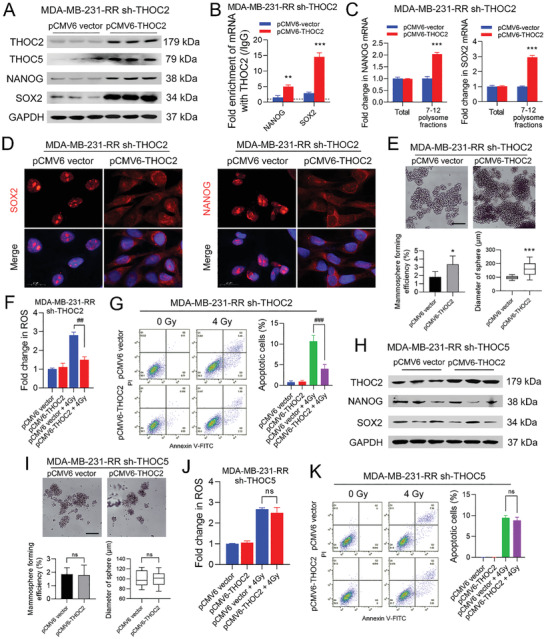
Figure 8.

THOC2 promotes stemness and radioresistance of TNBC cells in a THOC5‐dependent manner. THOC2 was rescued in THOC2‐silenced MDA‐MB‐231‐RR cells by the transfection of a THOC2‐overexpressing pCMV6 plasmid. A) The protein expression of THOC2, THOC5, NANOG, and SOX2 was detected by WB. GAPDH was used as the loading control. B) The enrichment of NANOG and SOX2 mRNAs against THOC2 and IgG antibodies in TNBC cell lines was analyzed by RIP analysis. C) The relative expression of polysome‐associated NANOG and SOX2 mRNAs (fractions 7–12) was detected by qRT‐PCR. D) The intracellular distribution of NANOG and SOX2 mRNAs was evaluated by RNA‐FISH. Representative images are shown at 630× magnification. Red represents target mRNA, while blue represents the nuclei. E) The stemness of cells was evaluated by mammosphere formation assay. The formation efficiency and sphere volume were calculated, and representative images are shown at 100× magnification. THOC2‐silenced MDA‐MB‐231‐RR cells were transfected with a THOC2‐overexpressing pCMV6 plasmid and then treated with 0 or 4 Gy IR. F) The intracellular ROS level was detected 24 h after IR. G) The cell apoptosis was analyzed 24 h after IR using flow cytometry, and the percentage of apoptotic cells was calculated as the percentage of cells in Q2 and Q3. THOC2 was overexpressed in THOC5‐silenced MDA‐MB‐231‐RR cells by the transfection of a THOC2‐overexpressing pCMV6 plasmid. H) The protein expression of THOC2, NANOG, and SOX2 was detected by WB. GAPDH was used as the loading control. I) The stemness of cells was evaluated by mammosphere formation assay. The formation efficiency and sphere volume were calculated, and representative images are shown at 100× magnification. THOC5‐silenced MDA‐MB‐231‐RR cells were transfected with a THOC2‐overexpressing pCMV6 plasmid and then treated with 0 or 4 Gy IR. J) The intracellular ROS level was detected 24 h after IR. K) The cell apoptosis was analyzed 24 h after IR using flow cytometry, and the percentage of apoptotic cells was calculated as the percentage of cells in Q2 and Q3. ns, nonsignificant; *P < 0.05, **P < 0.01, and ***P < 0.001 versus vector group; ## P < 0.01 and ### P < 0.001 versus vector + IR group (n = 3).
