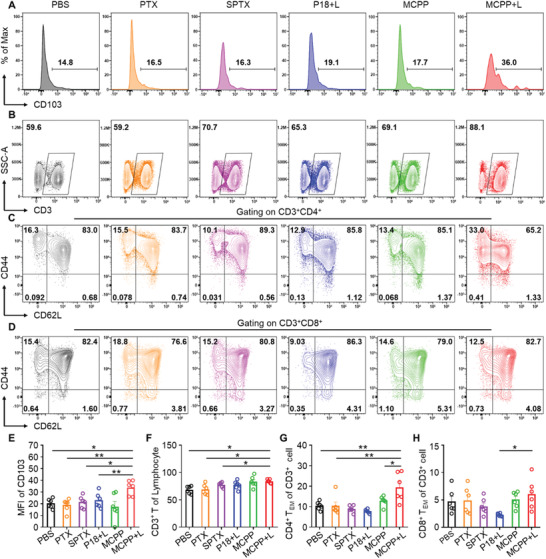
Figure 5.

MCPP+L therapy initiates T‐cell clone expansion and differentiation. A) Flow cytometry revealed CD103 expression on lymph node DCs from each group, mean fluorscence intensity (MFI). B) Flow cytometry revealed the CD3+ T‐cell proportion in lymph nodes. C) Flow cytometry revealed CD44 and CD62L expressions on CD3+CD4+ T cells. D) Flow cytometry revealed CD44 and CD62L expressions on CD3+CD8+ T cells. E) Quantitative analysis of the difference in CD103 expression on lymph node DCs among each group (n = 6). F) CD3+ T‐cell proportion was increased in lymph nodes after MCPP+L therapy (n = 6). G) CD44+CD62L−CD4+ effector memory T cells (TEM) were increased after MCPP+L therapy (n = 6). H) CD44+CD62L−CD8+ effector memory T cells (TEM) were increased in the MCPP+L group compared with the P18+L group (n = 6). (*p < 0.05, **p < 0.01, ***p < 0.001, and ****p < 0.0001).
