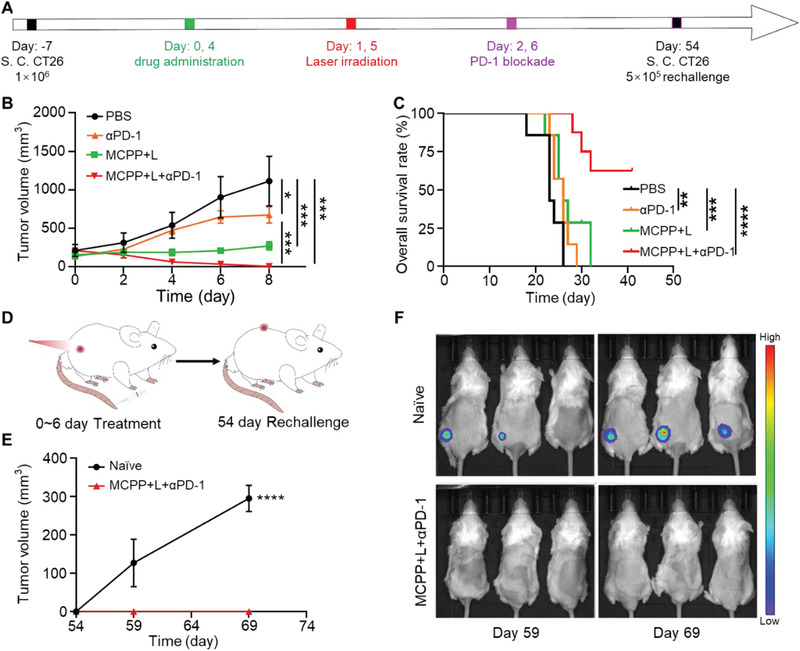
Figure 6.

MCPP+L+anti‐PD‐1 therapy prevent tumor recurrence. A) Tumor inoculation and treatment strategy. B) Tumor growth curve of each group, anti‐PD‐1 (αPD‐1) (n = 7). C) Overall survival rate of mice in each group. D) Schematic illustration of the rechallenged experimental design (n = 7). E) Tumor growth curve of the naïve and rechallenged groups (n = 3). F) In vivo bioluminescence images monitoring tumor recurrence/growth in naïve and rechallenged groups. (*p < 0.05, **p < 0.01, ***p < 0.001, and ****p < 0.0001).
