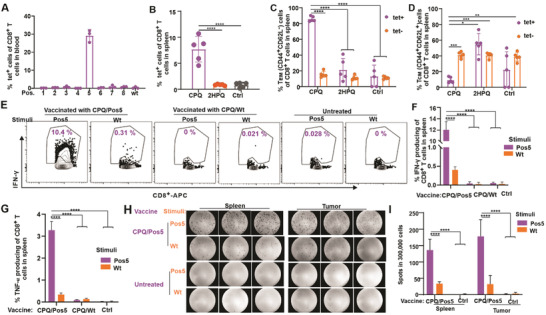
Figure 2.

CD8+ T cells responses induced by the Env37‐44‐Pos5 positional library particle vaccine. BALB/c mice were untreated or vaccinated with CPQ and indicated peptide libraries on days 0 and 7, then blood was collected on day 14. A) Percentage of Env37‐44 tet+ cells in the CD8+ T cell population in blood. Error bars show mean ± std. dev. for n = 3 mice per group. BALB/c mice were untreated or vaccinated on days 0 and 7, then splenocytes were prepared on day 14. B) Percentage of Env37‐44 tet+ cells in the CD8+ T‐cell population in spleen. C) TEM (CD44+CD62L–) cells or D) TCM (CD44+CD62L+) in the Env37‐44 tet+ CD8+ T cell or Env37‐44 tet– CD8+ T cell population. Error bars show mean ± std. dev. for n = 5 mice per group. E) Flow cytometry gating and F) percentage of IFN‐γ and G) TNF‐α producing cells in the CD8+ T cell population after 10 µg mL–1 Ag stimulation. Error bars show mean ± std. dev. for n = 3 mice per group. BALB/c mice were inoculated with CT26 tumor on day 0, then vaccinated on day 8 and 15; splenocytes and tumor infiltrating lymphocytes (TIL) were prepared on day 21 for analysis. Splenocytes or TIL from CPQ/Env37‐44‐Pos5 vaccinated mice and untreated mice were stimulated with Pos5 library and wild‐type peptide for 24 h. H) Images of ELISpot results. Images show results of three biological replicates. I) Summary of the ELISpot results. Error bars show mean ± std. dev. for n = 3 mice per group. * p < 0.05, ** p < 0.01, *** p < 0.001, and **** p < 0.0001, analyzed by (B, C, D, F, G, I) one‐way ANOVA with Tukey multiple comparisons post‐test.
