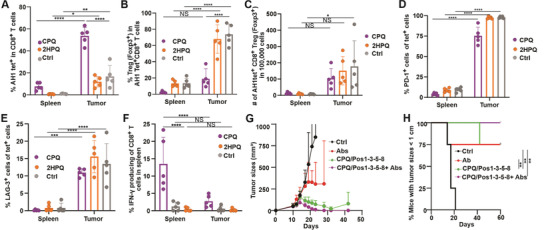
Figure 7.

Synergistic effects of CPQ/Pos1‐3‐5‐8 vaccine and PD‐1 and CTLA‐4 monoclonal antibodies combination therapy. BALB/c mice were inoculated with CT26 cells subcutaneously on day 0 and immunized 12 and 19 d later. Spleen and tumor tissues were collected 26 days post‐tumor inoculation for CD8+ T cell analysis. A) Percentage of AH1 tet+ cells within the CD8+ T cell population. B) Percentage of Treg (Foxp3+) cells within the tet+CD8+ T cells. C) Number of tet+CD8+ Treg in 100 000 cells. Percentage of PD‐1+ (D), LAG‐3+ (E) cells within the tet+CD8+ T cells. F) IFN‐γ + cells within tet+CD8+ T cells after 10 µg mL–1 Ag stimulation in vitro. Error bars in A, B, C, D, E, F show mean ± std. dev. for n = 5 mice per group. BALB/c mice were inoculated with CT26 cells on day 0 and either remained untreated or vaccinated with CPQ/Pos1‐3‐5‐8 on days 10 and 17 or vaccinated with CTLA‐4 and PD‐1 antibodies on day 12, 14, 19, 21 (Abs) or vaccinated with vaccine on day 10 and 17 and CTLA‐4 and PD‐1 antibodies on day 12, 14, 19, 21 (CPQ/Pos1‐3‐5‐8+Abs). G) Tumor growth of mice. H) Mice with tumor sizes smaller than 1 cm. Error bars in G, H show mean ± std. dev. for n = 4 mice per group. * p < 0.05, ** p < 0.01, *** p < 0.001 and **** p < 0.0001, analyzed by two‐way ANOVA (A, B, C, D, E, F) with Bonferroni multiple comparisons post‐test or long rank test (H).
