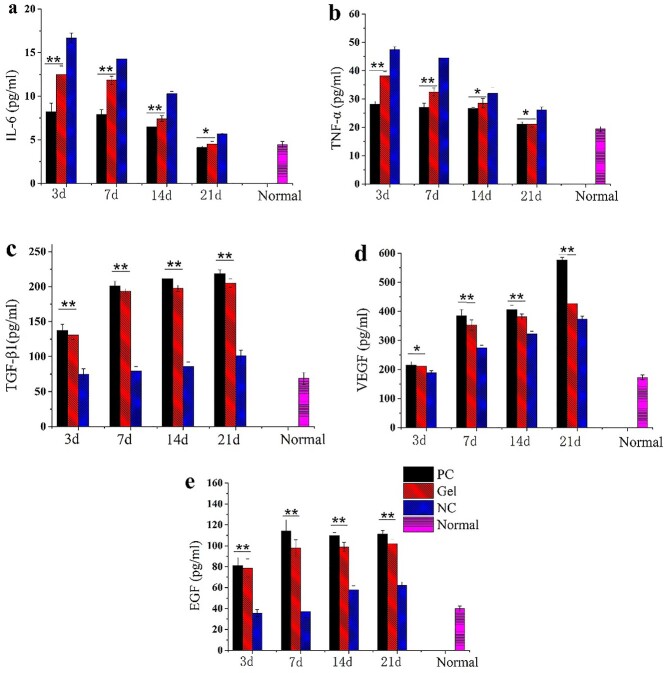
Figure 10.
Quantitative analysis of various cytokine content in the wound tissue by employing the ELISA method. The values have been expressed as mean ± SD. One-way ANOVA was used to evaluate the differences. *p < 0.05 and **p < 0.01 vs NC (a) Quantitative determination of IL-6 content. (b) Quantitative determination of TNF-α content. (c) Quantitative determination of TGF-β1 content. (d) Quantitative determination of VEGF content. (e) Quantitative determination of EGF content. GEL indicated CBM/CMC/EEO hydrogel. PC positive control, NC negative control, VEGF vascular epidermal growth factor, EGF epidermal growth factor

