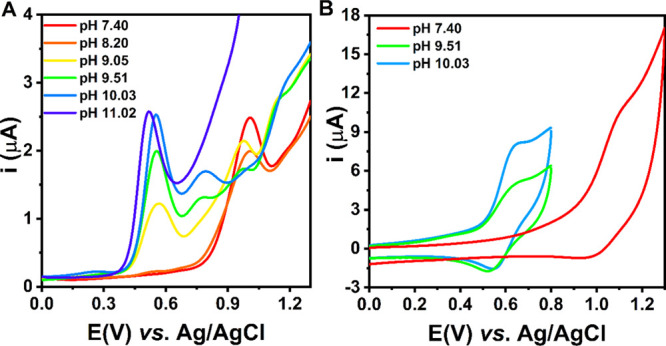
Figure 3.

DPV (A) and selected CV (B) curves of the titration of Ni(II)–Aβ5–9 (0.9:1.0 ratio) with KOH, recorded in 100 mM KNO3, scan rate: v = 0.1 V/s. The CV curves at pH 9–10 in panel B were recorded in a shorter potential range to avoid the effect of the other processes at high potentials on the Ni(III) reduction in the reverse scan.
