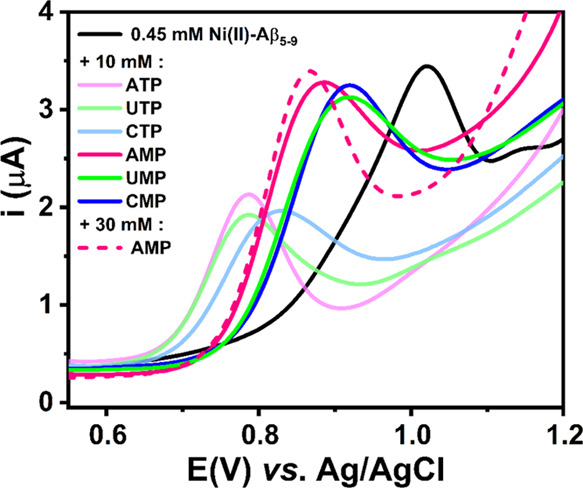
Figure 5.

DPV curves obtained for 0.45 mM Ni(II)–Aβ5–9 alone (a black curve), after the addition of 10 mM nucleoside monophosphates (pink, blue, and green curves) or nucleoside triphosphates (faded pink, blue, and green curves), and after the addition of 30 mM adenosine monophosphate (a dashed pink curve). The measurements were done in 100 mM KNO3 at pH 7.4.
