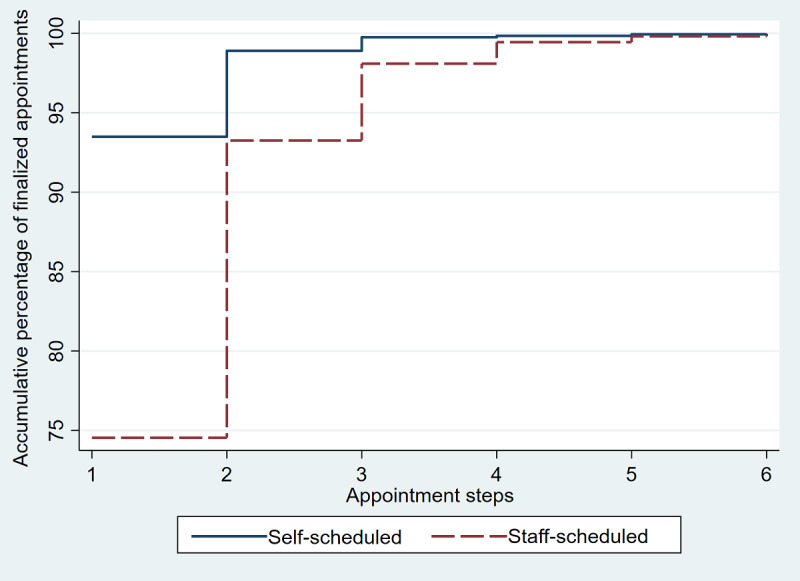
Figure 5.

Comparison of accumulated percentage of exclusively self-scheduled finalized appointments to that of staff-scheduled finalized appointments by number of appointment steps completed. The graph shows that for each appointment step, the cumulative percentage of self-schedulers successfully completing the appointment process at that step was greater than that of those who used staff schedulers.
