Figure 1.
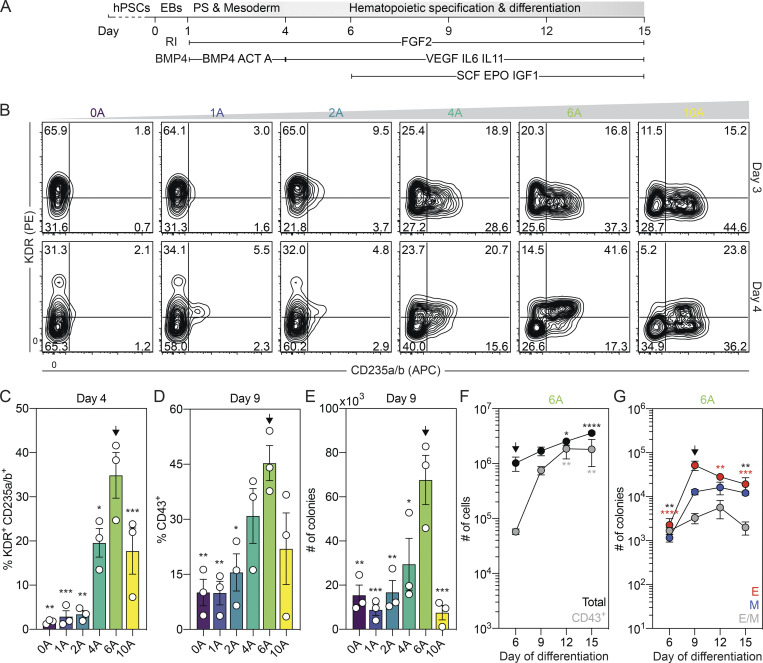
Specification of yolk sac–like hematopoietic mesoderm from hPSCs. (A) Schematic of hematopoietic differentiation from hPSCs through the addition of Activin A (ACT A), BMP4, and FGF2 followed by culture in the presence of VEGF, FGF2, and hematopoietic cytokines. PS, primitive streak; RI, ROCK inhibitor. (B) Representative flow cytometric analysis of KDR and CD235a/b expression on days 3 and 4 of differentiation in cultures induced with different concentrations of Activin A (A; ng/ml). (C) Quantification of the proportion of KDR+CD235a/b+ cells generated on day 4 of differentiation for a given concentration of Activin A (A; ng/ml; n = 3). ANOVA. *, P < 0.05; **, P < 0.01; and ***, P < 0.001 versus cultures induced with 6 ng/ml of Activin A (arrow). (D) Quantification of the proportion of CD43+ hematopoietic cells on day 9 of differentiation for a given concentration of Activin A (A; ng/ml; n = 3). ANOVA. *, P < 0.05; **, P < 0.01 versus cultures induced with 6 ng/ml of Activin A (arrow). (E) Colony-forming progenitor number on day 9 of differentiation for a given concentration of Activin A (A; ng/ml) based on an input of 500,000 H1 hESCs (n = 3). ANOVA. *, P < 0.05; **, P < 0.01; and ***, P < 0.001 versus cultures induced with 6 ng/ml of Activin A (arrow). Counts represent the sum of the erythroid, myeloid, and mixed erythromyeloid colonies. (F) Quantification of the number of total (black) and CD43+ (gray) cells generated from 500,000 input H1 hESCs in 6 ng/ml Activin A–induced cultures at the indicated days (n = 4). ANOVA. *, P < 0.05; **, P < 0.01; and ****, P < 0.0001 versus the indicated population on day 6 of differentiation (arrow). (G) Colony-forming progenitor numbers generated between days 6 and 15 of differentiation in cultures induced with 6 ng/ml Activin A based on an input of 500,000 H1 hESCs (n = 3). ANOVA. **, P < 0.01; ***, P < 0.001; and ****, P < 0.0001 versus the indicated lineage on day 9 of differentiation (arrow; black = all colonies). Colonies: E, erythroid (red); M, myeloid (blue); E/M, mixed erythro-myeloid (gray).

