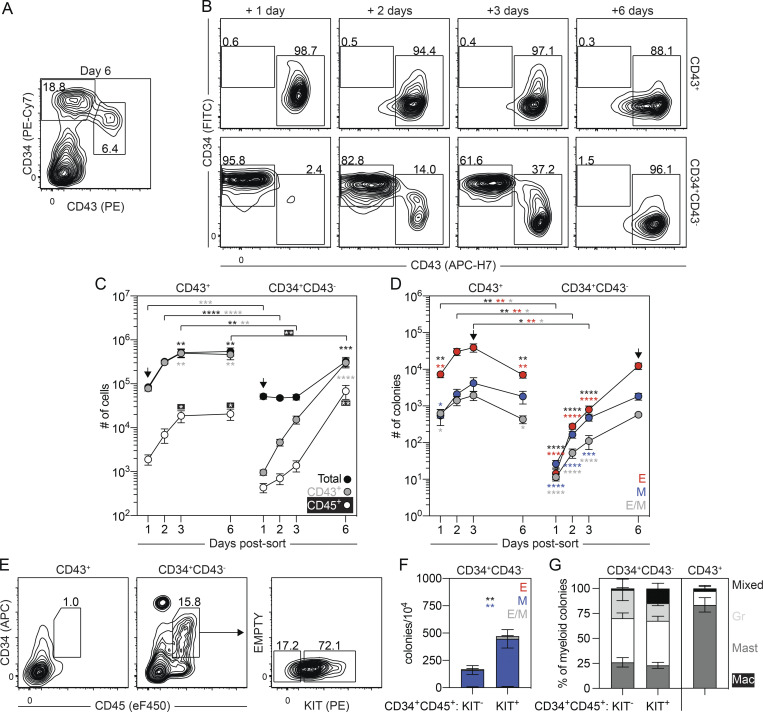
Figure 3.
Separation of the primitive and EMP programs on day 6 of differentiation. (A) Representative flow cytometric analysis of CD34 and CD43 expression on day 6 of differentiation, including the gating strategy used to isolate the day 6 CD43+ and CD34+CD43− populations. (B) Representative flow cytometric analysis of CD34 and CD43 expression in cultures generated from FACS-isolated day 6 CD43+ and CD34+CD43− cells. (C) Quantification of the number of total (black), CD43+ (gray), and CD45+ (white) cells generated from 62,500 day 6 CD43+ or CD34+CD43− isolated cells (n = 5). t test and ANOVA. **, P < 0.01; ***, P < 0.001; and ****, P < 0.0001 versus the stage-matched sample or versus after 1 d of culture within the same sample (arrow), as indicated. (D) Colony-forming progenitor numbers in populations generated from 62,500 day 6 CD43+ or CD34+CD43− cells (n = 5). t test and ANOVA. *, P < 0.05; **, P < 0.01; and ****, P < 0.0001 versus the stage-matched sample or versus after 1 d of culture within the same sample (arrow), as indicated (black = all colonies). Colonies: E, erythroid (red); M, myeloid (blue); E/M, mixed erythromyeloid (gray). (E) Representative flow cytometric analysis of CD34 and CD45 expression following 5 d of culture of day 6 CD43+ and CD34+CD43− cells, including the gating strategy used to isolate the KIT+ and KIT− CD34+CD45+ populations generated from the day 6 CD34+CD43− population. (F) Colony-forming progenitor frequency in the isolated CD34+CD45+ populations shown in E (n = 3). ANOVA. **, P < 0.01 versus the indicated lineage (black = all colonies). Colonies: E, erythroid (red); M, myeloid (blue); E/M, mixed erythro-myeloid (gray). (G) Distribution of myeloid progenitors observed in F and after 3 d of culture of the day 6 CD43+ population. Colonies: Mac, macrophage (white); Mast, mast cell (dark gray); Gr, granulocyte (light gray); mixed, mixed lineage myeloid (black).

