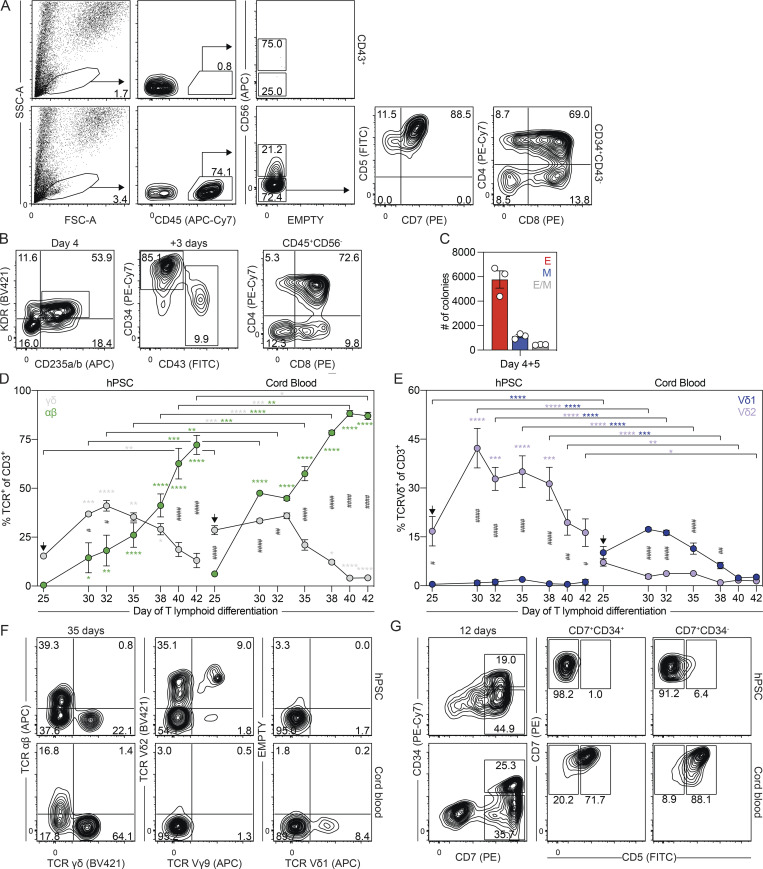
Figure 4.
The day 6 CD34+CD43− population give rise a unique T lymphoid lineage. (A) Representative flow cytometric analysis of CD45, CD56, CD5, CD7, CD4, and CD8 expression on cells derived from the day 6 CD43+ or CD34+CD43− populations following 30 d of culture with OP9-DL4 cells. FSC-A, forward scatter area; SSC-A, side scatter area. (B) Gating strategy used for the FACS-based isolation of day 4 KDR+CD235a/b+ cells, which give rise to CD43+ and CD34+CD43− populations when cultured as aggregates for 3 d. Transfer of these cultures to OP9-DL4 cells generated T lymphoid progenitors marked by the presence of CD45+CD56−CD4+CD8+ cells after 30 d. (C) Colony-forming progenitor number after 5 d of culture of 62,500 day 4 KDR+CD235a/b+ cells (n = 3). Colonies: E, erythroid (red); M, myeloid (blue); E/M, mixed erythro-myeloid (gray). (D) Quantification of the frequency of γδ (gray) and αβ (green) CD3+ T cells between days 25 and 42 of T lymphoid differentiation in cultures derived from day 6 CD34+CD43− or cord blood CD34+ cells (n = 3). ANOVA. *, P < 0.05; **, P < 0.01; ***, P < 0.001; and ****, P < 0.0001 versus the stage and population-matched sample or versus day 25 of T lymphoid differentiation (arrow), as indicated. #, P < 0.05; ##, P < 0.01; and ####, P < 0.0001 between stage-matched γδ and αβ T cells for the indicated sample. (E) Quantification of the frequency of Vδ1+ (blue) and Vδ2+ (purple) CD3+ T cells between days 25 and 42 of T lymphoid differentiation in cultures derived from day 6 CD34+CD43− or cord blood CD34+ cells (n = 3). ANOVA. *, P < 0.05; **, P < 0.01; ***, P < 0.001; and ****, P < 0.0001 versus the stage- and population-matched sample or versus day 25 of T lymphoid differentiation (arrow), as indicated. #, P < 0.05; ##, P < 0.01; and ####, P < 0.0001 between stage-matched Vδ1+ and Vδ2+ T cells for the indicated sample. (F) Representative flow cytometric analysis of TCRγδ+, TCRαβ, Vδ1, Vδ2, and Vγ9 expression on day 35 of T lymphoid differentiation in cultures derived from day 6 CD34+CD43− or cord blood CD34+ cells. (G) Representative flow cytometric analysis of CD34, CD7, and CD5 expression on cells derived from day 6 CD34+CD43− or cord blood CD34+ cells following 12 d of culture with OP9-DL4 cells.

