Figure S4.
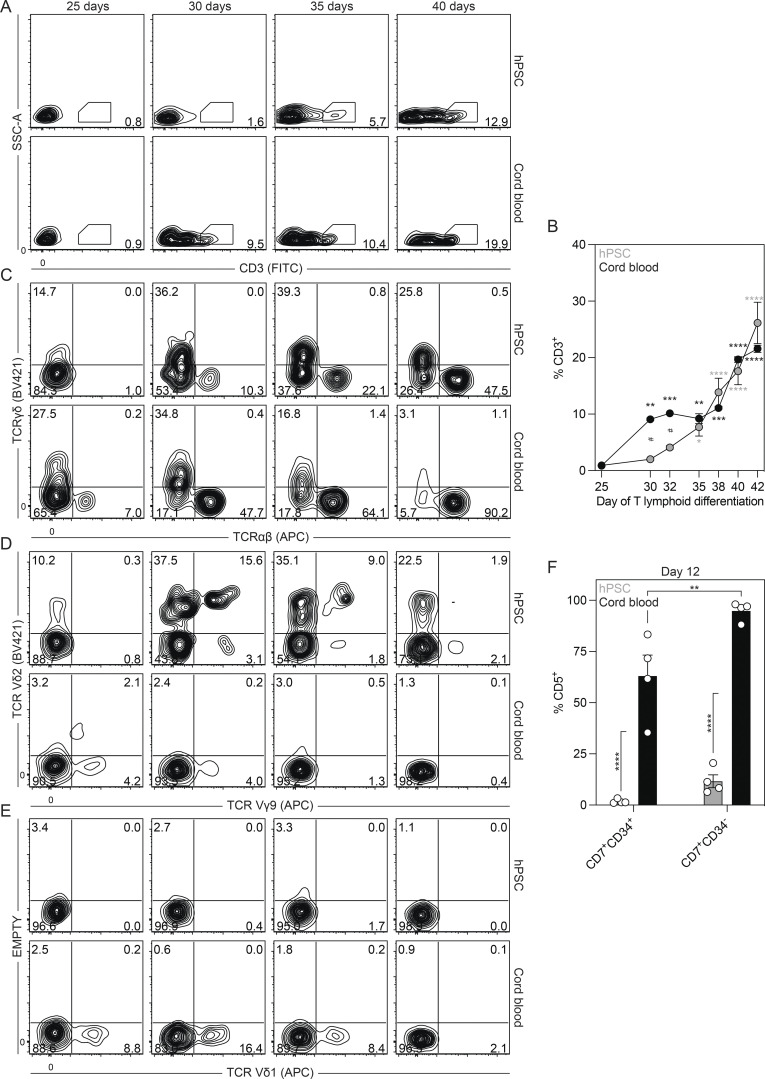
Characterization of the embryonic T cell lineage. Related to Fig. 4. (A) Representative flow cytometric analysis of CD3 expression between days 25 and 40 of T lymphoid differentiation in cultures derived from day 6 CD34+CD43− or cord blood CD34+ cells. SSC-A, side scatter area. (B) Quantification of the frequency of CD3+ cells between days 25 and 42 of T lymphoid differentiation in cultures derived from day 6 CD34+CD43− (gray) or cord blood CD34+ (black) cells (n = 3). ANOVA. *, P < 0.05; **, P < 0.01; ***, P < 0.001; and ****, P < 0.0001 versus day 25 of T lymphoid differentiation for the indicated population and #, P < 0.05 versus the stage-matched sample. (C) Representative flow cytometric analysis of TCRγδ and TCRαβ expression between days 25 and 40 of T lymphoid differentiation in cultures derived from day 6 CD34+CD43− or cord blood CD34+ cells. (D) Representative flow cytometric analysis of Vγ9 and Vδ2 expression between days 25 and 40 of T lymphoid differentiation in cultures derived from day 6 CD34+CD43− cells or cord blood CD34+ cells. (E) Representative flow cytometric analysis of Vδ1 expression between days 25 and 40 of T lymphoid differentiation in cultures derived from day 6 CD34+CD43− or cord blood CD34+ cells. (F) Quantification of frequency CD5+ cells in the CD34+CD7+ and CD34−CD7+ populations derived from day 6 CD34+CD43− (gray) or cord blood CD34+ (black) cells after 12 d of culture with OP9-DL4 cells (n = 4). ANOVA. **, P < 0.01; ****, P < 0.0001 versus the indicated sample.

