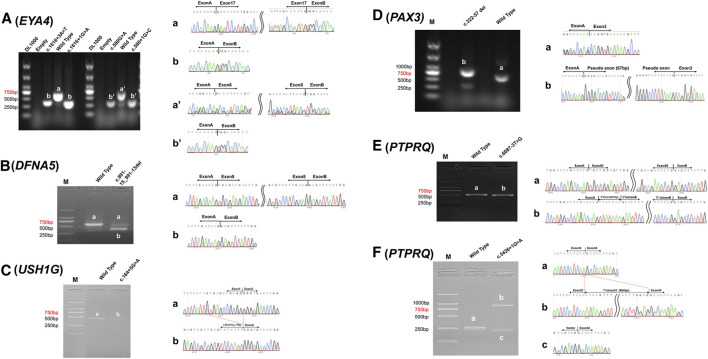
FIGURE 3.
Minigene assay analysis of c.1616+3A > T and c.580G > A in EYA4 (A) , c.991-15_991-13del in DFNA5 (B), c.164+5G > A in USH1G (C), c.322-57_322-8del in PAX3 (D), c.6087-3T > G (E), and c.5426+1G > A (F) in PTPRQ. left column. Reversed transcriptional analysis showing distinct bands (a, b, a′ and b′); right column. Sequencing results of the corresponding bands.

