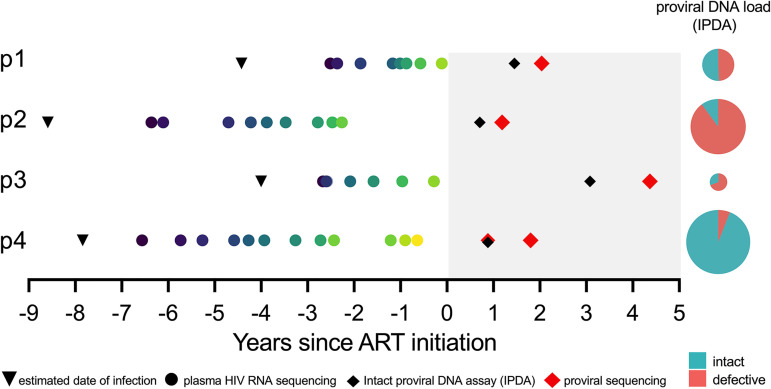
FIG 1.
Participant (p1 to p4) sampling timeline and reservoir quantification. The timeline is depicted as years since ART initiation. Shading represents ART. Inverted black triangles denote the clinically estimated date of infection. Colored circles denote pre-ART plasma samples from which HIV RNA sequences were isolated. Red diamonds denote cell samples on ART from which proviral sequences were isolated. Black diamonds denote proviral quantification dates using the intact proviral DNA assay (IPDA). IPDA results are shown as pie charts, where the pie size denotes the total proviral burden and the colored slices denote intact and defective HIV genome proportions (actual values shown in Table 1).

