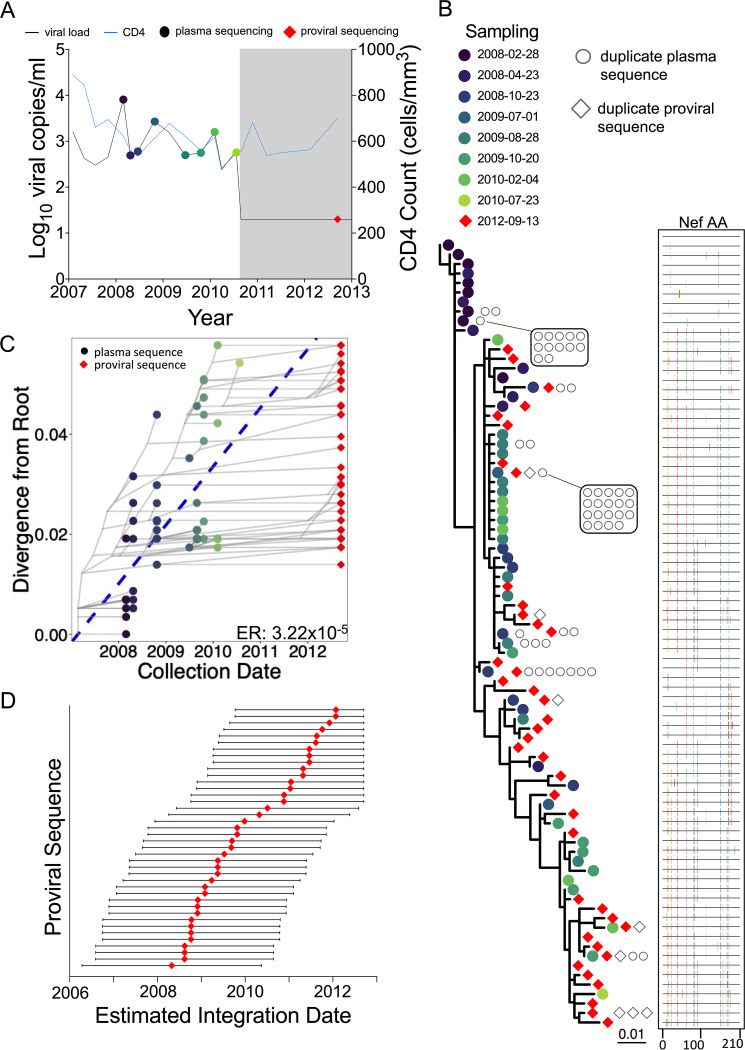
FIG 3.
Participant 1. (A) Clinical history and sampling timeline. Throughout all figures, circles denote plasma HIV RNA sampling and diamonds denote HIV DNA sampling. Shading represents ART. Undetectable viral loads are shown as 20 (1.3 log10) copies/ml. (B) Maximum likelihood within-host phylogeny and corresponding amino acid highlighter plot. In the phylogeny, colored circles denote distinct pre-ART plasma HIV RNA sequences and red diamonds indicate distinct proviral sequences sampled during suppressive ART. Sequences that were recovered repeatedly are shown as open gray circles (for plasma HIV RNA) and diamonds (for proviruses) adjacent to the relevant tip. The root represents the inferred most recent common ancestor of the data set, representing the phylogenetically inferred transmitted founder virus event. The highlighter plot is ordered according to the phylogeny and depicts amino acid sequences. The top sequence serves as the reference, where colored ticks in sequences beneath it denote nonsynonymous substitutions with respect to the reference. (C) HIV sequence divergence-versus-time plot. The blue dashed line represents the linear model relating the root-to-tip distances of distinct pre-ART plasma HIV RNA sequences (colored circles) to their sampling times. This model is then used to convert the root-to-tip distances of distinct proviral sequences sampled during ART (red diamonds) to their original integration dates. The slope of the regression line, which represents the inferred within-host evolutionary rate (ER) in estimated substitutions per nucleotide site per day, is shown at the bottom right. Faint gray lines denote the ancestral relationships between HIV sequences. (D) Integration date point estimates (and 95% confidence intervals) for distinct proviral sequences recovered from this participant.

