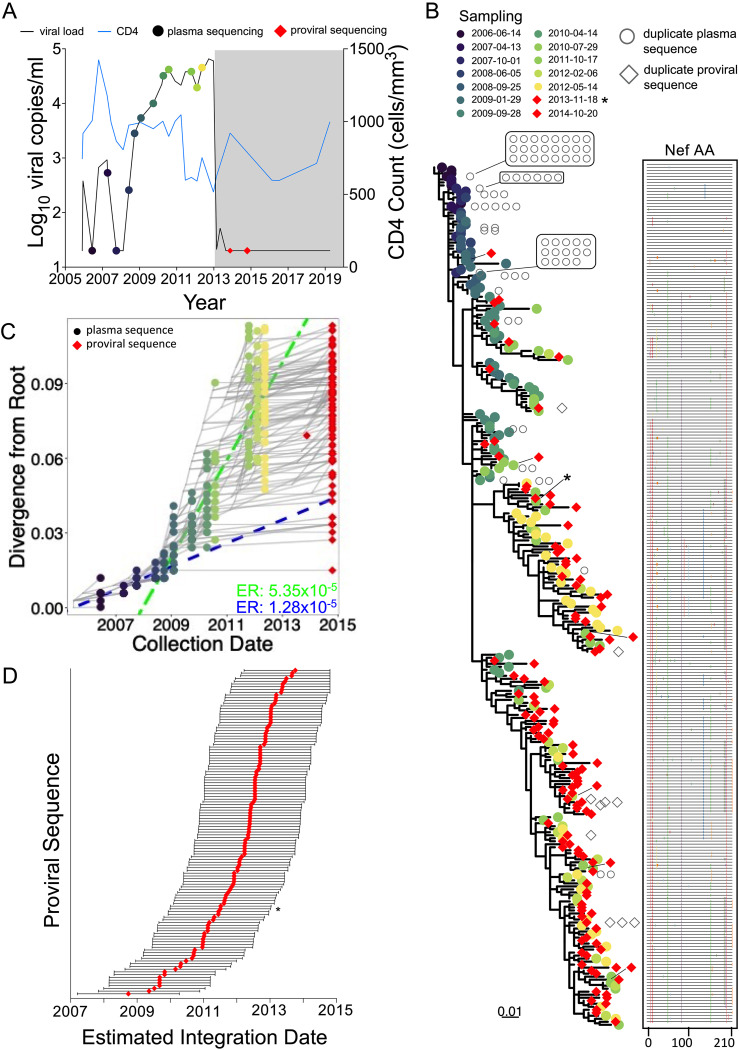
FIG 6.
Participant 4. The panels are as described in the legend of Fig. 3, with the following additions. In panels B and D, the red diamond indicated by an asterisk represents the genomically intact HIV sequence isolated from the 2013 sample. In panel C, two linear models were fit to the data, encompassing the viremic control (blue dashed line) and the “loss-of-control” (green dashed line) periods. Corresponding evolutionary rates are shown in the bottom right corner in matching colors. The regression for the control period was performed using plasma time points 14 June 2006 (i.e., 2006-06-14) to 25 September 2008, while post-control period regression was performed using plasma time points 29 January 2009 to 14 May 2012.

